


Thursday, May 12, 2016 9:27:06 AM
Generally, I suspect weakness now appears again.
There were two pre-market buys, $1.55 x 925 & 2.5K.
09:30-10:04 opened the day with a 14,332 buy for $1.52 and another 4,205 traded $1.51-$1.53. Then did 9:31's 895 $1.50, 9:35-:36's ~5.2K $1.51->$1.53, 9:38's ~9.8K $1.52->$1.50, 9:39-:41's ~9K $1.51/2, 9:42's ~6.2K $1.51, 9:43's ~17.1K $1.50->$1.51, 9:44-:49's low/medium-volume $1.51/2, 9:50-10:04 very low/no-volume $1.50/$1.51 and ended the period on 10:04's ~1.5K $1.50.
10:05-10:17 began a mostly low/no-volume down, short flat, down, short flat, ... on 10:05's ~4.6K $1.50->$1.48, hit 10:14's 2K $1.48->$1.47, and 10:17's ~1.2K $1.46/$1.4615 ended the period.
10:18-10:59, after a no-trades five minutes, began a variable-volume halting climb back up on 10:23's $1.46->$1.47, hit 10:29's ~2.3K $1.47->$1.49, hit 10:35's ~13.4K $1.49->$1.50, did 10:36-10:54's mostly no, some low, volume $1.49/50, hit 10:56-:57's ~15.3K $1.50->$1.52, and hit 10:59's 400 $1.53 (hitting minimal chart resistance) to end the period.
11:00-11:49, after a no-trades minute, began an initially mostly medium-volume, through 11:09, and then very low/no-volume $1.50/1 after doing 11:01-:03's ~5.8K $1.51->$1.53->$1.51. The no/low-volume was interrupted by 11:19-:23's 17.7K $1.50/1. 11:49's 100 $1.50 ended the period.
11:50-12:09 did a mostly low/no-volume step up beginning with 11:50-:51's ~9.7K $1.51->$1.52, hit 11:52's 203 $1.53 (minimal chart resistance again), and did 11:53-12:09's mostly very low/no-volume $1.52/3, interrupted by 11:54's ~6.1K, 11:59's ~2.9K and 12:03's 5K. 12:09's 495 $1,53 ended the period.
12:10-13:15 began a very low/no-volume $1.52/3 through 12:19 with 12:10's 2.2K $1.53->$1.54 (new intra-day high, ignoring the pre-market trades, and matches yesterday's high), 12:20-13:15 went very low/no-volume $1.51/2 and ended the period on 13:15's 100 $1.52.
13:16-14:46, after a no-trades minute, began mostly low/no-volume $1.52/3 with 13:17's 100 $1.53. The low-volume was interrupted by higher volumes in that range on 13:30's 4.4K, 13:35's 7.7K, and 13:37's 10.1K. A huge b/a imbalance of 27.3K:4.5K $1.52/3, which I think was just to hold price up, appeared around 13:45. Volume switched to much more low/medium-volume at 14:25 and even saw a big minute, 14:35's ~16.3K. 14:46's 100 $1.52 ended the period.
14:47-15:28 began a mostly low/no-volume $1.53/4 on 14:47's ~29.6K $1.52->$1.54->$1.53 and ended the period on 15:28's 100 $1.53.
15:29-16:00, after a no-trades two-minutes, began the EOD volatility with 15:31's ~23.7K $1.52/3, staying in that range on very low/no-volume, interrupted by 15:44's 18.7K $1.52/4, through 15:57 and then did 15:58-:59's ~20.5K $1.52->$1.51 and ended the period and day on a closing 284 buy for $1.53.
There were no AH trades.
Including the opening trade (closing didn't qualify), there were 25 larger trades (>=5K) totaling 173,720, 37.16% of day's volume, with a $1.5106 VWAP. Excluding the opening trade, there were 24 larger trades totaling 159,388, 34.10% of day's volume, with a $1.5097 VWAP.
On the traditional TA front, movements were:Ending Period Period Period __Per. Trade_ Period_ % Day_ Per. End
Period Volume Low High _Dollar Val._ VWAP___ Volume Buy ~%
09:17 3225 $1.5500 $1.5500 $4,998.75 $1.5500 0.69% 100.0%
10:04 86869 $1.5000 $1.5300 $131,411.48 $1.5128 18.58% 39.80% Incl 09:30 $1.5200 14,332 09:40 $1.5140 5,000
09:42 $1.5064 5,000 09:43 $1.5000 13,300
09:47 $1.5141 5,805
10:17 18555 $1.4600 $1.5000 $27,502.97 $1.4822 3.97% 36.89% Incl 10:06 $1.4788 5,000
10:59 58912 $1.4600 $1.5300 $87,824.92 $1.4908 12.60% 45.56% Incl 10:23 $1.4700 10,000 10:27 $1.4699 5,000
10:35 $1.4900 12,500
11:49 48022 $1.5000 $1.5299 $72,433.86 $1.5083 10.27% 47.85% Incl 11:09 $1.5010 5,370 11:19 $1.5001 5,000
11:23 $1.5090 4,700
12:09 27746 $1.5100 $1.5300 $42,132.45 $1.5185 5.94% 48.26% Incl 11:50 $1.5100 4,214 11:54 $1.5201 5,000
12:03 $1.5201 5,000
13:15 22000 $1.5100 $1.5399 $33,542.19 $1.5246 4.71% 47.84% Incl 12:14 $1.5301 5,000
14:46 72860 $1.5200 $1.5300 $111,087.74 $1.5247 15.59% 46.39% Incl 13:37 $1.5300 9,700 14:35 $1.5200 13,160
15:28 57203 $1.5200 $1.5400 $87,490.75 $1.5295 12.24% 44.65% Incl 14:47 $1.5200 5,192 $1.5200 4,497 6,950
16:00 68269 $1.5100 $1.5400 $104,139.61 $1.5254 14.60% 42.06% Incl 15:31 $1.5300 5,400 5,500 4,000 9,100
On my minimal chart we bottomed about mid-way between the rising support (rising orange line) and the resistance at $1.53. Significantly, we again topped a penny above the $1.53 resistance (upper red line) and closed right on it. I had mentioned I thought it could be strong resistance and it's proving out thus far as three of the last five days have topped at $1.54 and then closed at or below $1.53.__Open_ ___Low_ __High_ _Close_ Volume_
Today 9.35% 5.04% 0.00% 4.79% -32.94%
Prior -4.14% 5.30% 6.21% 5.80% 25.27%
With the second of an anticipated three-day cycle on the PR under our belts and falling volume, I suspect the long trade opportunity is about over. Furthermore, I now have increased concern of a possible H & S developing, although the symmetry is not what I would like, as mentioned previously.
Just because it's ugly doesn't mean it ain't bad! Moving on the the more mundane ...
We did have some positives in a higher open and low that respected yesterday's close as a bottom (although we should remember the suspicious AH trade was suggesting this might be the case). We also spent the majority of the day in the upper part of the day's range - from 10:53 onward we remained >= $1.50. However, keeping my TFH in mind, this may not be the positive it seems at first glance.
Another positive is the rising support - orange line - which has now enough touches, and one with substantive volume, to be a known strong support. Doesn't mean it won't break though. It's been challenged three of the last four days and if we challenge it again I think the repeated assaults will finally break below it. The key, I think, is to stay away from it.
In a battle between strong support and resistance and with no indication of tomorrow being manipulated higher (e.g. no suspicious AH trade(s), our history suggests resistance wins out.
On my one-year chart the 10-day SMA continues to decline and still did not begin to accelerate lower because we held our trading range. The formation of a potential right shoulder of an H & S pattern would be increasingly likely but for my suspicion that we won't get enough rise and symmetry going forward.
Regarding the 20-day SMA, the decline which began two days back continues and showed the first signs of accelerating.
The 50-day SMA rate of rise should continue to increase a bit if we just hold our range. The rise is still on track to continue for at least four more days because we held position.
The oscillators I watch which were all improved yesterday except accumulation/distribution, all improved, including accumulation/distribution but excluding ADX-related. Nothing is in oversold and full stochastic is above neutral. Everything else is still below neutral. RSI and Williams %R are close to getting above neutral.
The 13-period Bollinger limits, $1.3385 and $1.7492 ($1.3246 and $1.8000 yesterday), continue to converge and the mid-point continues falling. Our open and close were about mid-point, suggesting we'll go lower because that's our history - seldom up from there.
All in, things look to be improving but combined with the lower volume, my "three-day pop cycle", the stout $1.53 resistance, ... I think sideways at best and weaker more likely.
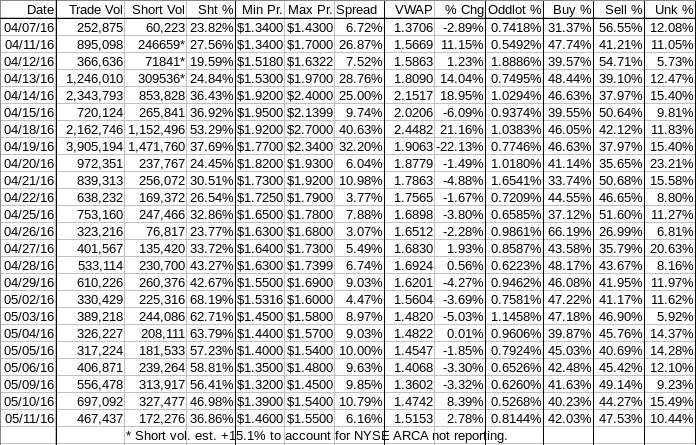
Percentages for daily short sales and buys moved in opposite directions, not a normal case, and the short percentage has now dropped to just inside the bottom of my desired range (needs re-check and I'm still unsure of the adjustment I make - we could be well below my range). The buy percentage movement was barely big enough to be worth noting. Likely both percentages should be discounted when the larger blocks' percentage of day's volume is considered. For short percentage it's because inter/intra-broker trades don't typically generate shorts sales.
The spread contracted nicely but is still wide. Combined with volume, how it was produced, and the third day of a PR pop tomorrow, I think this suggests weakness.
VWAP movement added another positive to our trend, giving us now eleven negative moves in the last fifteen readings, meaning our positives went from four to five. Just based on history, this trend is likely to end.
All in, not positive.
As always, much is experimental and should be treated as such.
Bill
Join the InvestorsHub Community
Register for free to join our community of investors and share your ideas. You will also get access to streaming quotes, interactive charts, trades, portfolio, live options flow and more tools.

