


Wednesday, May 11, 2016 9:07:35 AM
Buy:sell, daily shorts & pps 05/10 2016 EOD
A couple days of potential up-side, or at least a rising VWAP, seems possible based on today's stuff.
There was a PR about a C-800 sale that had two immediate effects. The important one was to bump today's early trading up. The second was to make yesterday's two larger block trades, totaling near ~100K much more interesting to me.
<SLAP!> I should have suspected something, no?
Anyway, looks like it did it's job as we were up in so many ways ... Except for the buyers of course - that ended at 15:59 in our now-normal area at 40.23%. Sellers continued to take advantage of anything resembling strength.
We had a suspect AH trade - see below.
Something related to the PR response that occurred to me this morning was that it might be vewy intewesting to see if there is a pattern of PRs occurring as price dips (too?) low and appears set to drop lower. I wonder about this because I assume the the ATM might still be in play, or maybe the financiers haven't yet sucked all the blood out from their shares. We've a few occurrences of run-ups that seem unwarranted by the nature of the PR.
Oh, well ... We'll never know.
Regarding the effect, reason, timing of the PR ... I note that as with so many recent occurrences there's a "sell into strength effect" as the shares trade at very high relative price while buy percentage is horrid - today 9:45-10:15 it only moved from ~27% to ~40% and dropped back to ~34% by 10:30, ~28% by 10:45, and finally stabilized around our "normal" levels, 38%-42%.
The shorters are back, and sensibly so since we had that $2.70 high on 4/18, which was in the reporting period. Now that we're back at normal levels I guess they'll be seen in retreat again in the next semi-monthly short interest report. That may be why we're seeing a good response to the PR in terms of rising volume and price at the same time.
It's only day though and I suspect another day or two, maybe.
There were no pre-market trades.
09:30-10:15 opened the day with a 4,453 sell for $1.39 and traded another 4.2K as high $1.40. That began a long series of low/medium-volume steps up hitting 9:39's ~1.5k $1.42, 9:54's ~2.9K $1.45, 10:06's ~7.1K $1.46, 10:13's ~3.3K $1.48, and 10:15's 1.1K $1.49 ended the first rise.
10:16-11:13 began a mostly low-volume sideways $1.46/7 until 10:34's 60.8K $1.44/7. Then low-volume $1.46/7 through 10:42 was followed by mostly no and some low volume $1.46/7 to end the period on 11:13's 300 $1.46/7.
11:14-12:10 began another long series of low/medium-volume steps up on 11:14's ~12.6K $1.47/8 hitting 11:20's 11K $1.49, 11:36's 2.3K $1.50, 11:39's ~12.8K $1.51, 11:59's ~81.4K $1.52 (touching the minimal chart's resistance), and 12:10's ~12.1K $1.54 (penetrating the minimal chart's resistance) ended this run-up period.
12:11-12:53 began a low/no-volume $1.51/3 on 12:11's 720 $1.52/3 (right at the minimal chart's resistance) and ended the period on 12:53's 205 $1.52.
12:54-15:03, after a no-trades two minutes, began a mostly very low/no-volume flat, down, flat, down ... series with a drop on 12:56's 2.1K $1.51, hit 13:17's 400 $1.48/9, 14:19's 810 $1.47/9, 14:49's ~5.6K $1.45/6, and 15:03's 960 $1.44 ended the period.
15:04-16:00, after a no-trades six minutes, started a weak attempt, based on very low/no-volume, to rise just as we've seen so many times on PR days and also on normal late-day volatility periods. It did 15:10's ~1.7K 1.45, hit 15:12's 300 $1.46, and 15:25's 10.6K $1.45->$1.48->$1.46. From here through the end it was essentially a very low/no-volume $1.46/8 and ended the period and day with a closing 400 sell for $1.46.
There two AH buys: 16:16 2K for $1.49; 17:34 a suspect 100 for $1.53, 7 cents above the close and 1 cent below the day's high.
Excluding the opening and closing trades (didn't qualify), there were 22 larger trades (>=5K & 7 4K+) totaling 195,955, 28.11% of day's volume, with a $1.4787 VWAP.
Regarding "PR Pops" I typically expect a three-day cycle before the effects fade and "normal" behavior can be expected to begin telling the near-term story. With $CPST this has been less reliable than in some other stocks I watch.
On my one-year chart the 10-day SMA continues to decline and but did not begin to accelerate lower because we got a rise in trading range. We are beginning formation apotential right shoulder of an H & S pattern. Regarding the 20-day SMA, our range increase was insufficient to stop the decline which began yesterday. Unless we go to ~1.89 the decline will continue and accelerate now.
The 50-day SMA rate of rise should increase a bit if we just hold our range. Regardless of that, the rise is on track to continue for at least four more days if we just hold position.
The oscillators I watch, which yesterday had all but MFI (untrusted by me) weakening, switched to all improved today except accumulation/distribution. All are below neutral and everything is above oversold now.
The 13-period Bollinger limits, $1.3246 and $1.8000 ($1.3295 and $1.8459 yesterday) switched to converging as the lower limit began a rise. The mid-point is still falling as the upper limit decline rate is much higher than the lower limit's rate of rise.
All in, the rising volume and response to the support and resistance lines makes all this a believable near-term bullish pattern.
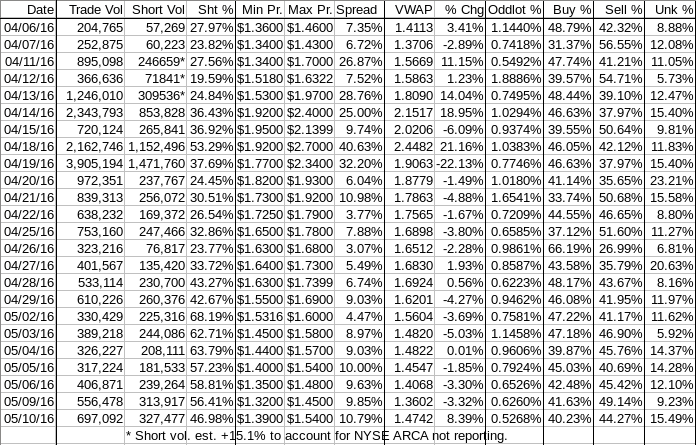
Percentages for daily short sales and buys moved in the same direction for the second consecutive day, unusual and welcome. The short percentage, still not known to be properly corrected, is barely above my desired range (needs re-check) and the buy percentage movement was marginal - call it unchanged. Further it's still well below what's needed for sustainable appreciation. Note my comment above about "selling into strength", which seems to be the case every time we get a PR now.
The spread is way too wide but was produced by the opposite of our usual. Today it was open low ago high, higher, higher, ... through ~12:15 before any sustained re-trace was seen. It was a much lower-volume over a longer time-frame re-trace too. This fits with my TFH-inspired push it up and sell into it but that's not germane right now as the numbers and method of production are telling the story. So I can't see the spread as suggesting near-term weakness.
VWAP movement added one positive to our negative trend, giving us now eleven negative moves in the last fifteen readings, meaning our positives went from three to four.
All in, I have to break my trend of near-term bearishness, regardless of buy percentage. Buy percentage will ultimately win out, but for the near term I believe the numbers suggest less negativism than normally. Adding in the volume and PR response, I think we've got another day or two in which we don't fall much. Maybe even a bit more up-side, but I expect our resistance is strong. Might only see a positive move in the VWAP getting another day or two of increase.
As always, much is experimental and should be treated as such.
Bill
A couple days of potential up-side, or at least a rising VWAP, seems possible based on today's stuff.
There was a PR about a C-800 sale that had two immediate effects. The important one was to bump today's early trading up. The second was to make yesterday's two larger block trades, totaling near ~100K much more interesting to me.
<SLAP!> I should have suspected something, no?
Anyway, looks like it did it's job as we were up in so many ways ... Except for the buyers of course - that ended at 15:59 in our now-normal area at 40.23%. Sellers continued to take advantage of anything resembling strength.
We had a suspect AH trade - see below.
Something related to the PR response that occurred to me this morning was that it might be vewy intewesting to see if there is a pattern of PRs occurring as price dips (too?) low and appears set to drop lower. I wonder about this because I assume the the ATM might still be in play, or maybe the financiers haven't yet sucked all the blood out from their shares. We've a few occurrences of run-ups that seem unwarranted by the nature of the PR.
Oh, well ... We'll never know.
Regarding the effect, reason, timing of the PR ... I note that as with so many recent occurrences there's a "sell into strength effect" as the shares trade at very high relative price while buy percentage is horrid - today 9:45-10:15 it only moved from ~27% to ~40% and dropped back to ~34% by 10:30, ~28% by 10:45, and finally stabilized around our "normal" levels, 38%-42%.
The shorters are back, and sensibly so since we had that $2.70 high on 4/18, which was in the reporting period. Now that we're back at normal levels I guess they'll be seen in retreat again in the next semi-monthly short interest report. That may be why we're seeing a good response to the PR in terms of rising volume and price at the same time.
It's only day though and I suspect another day or two, maybe.
There were no pre-market trades.
09:30-10:15 opened the day with a 4,453 sell for $1.39 and traded another 4.2K as high $1.40. That began a long series of low/medium-volume steps up hitting 9:39's ~1.5k $1.42, 9:54's ~2.9K $1.45, 10:06's ~7.1K $1.46, 10:13's ~3.3K $1.48, and 10:15's 1.1K $1.49 ended the first rise.
10:16-11:13 began a mostly low-volume sideways $1.46/7 until 10:34's 60.8K $1.44/7. Then low-volume $1.46/7 through 10:42 was followed by mostly no and some low volume $1.46/7 to end the period on 11:13's 300 $1.46/7.
11:14-12:10 began another long series of low/medium-volume steps up on 11:14's ~12.6K $1.47/8 hitting 11:20's 11K $1.49, 11:36's 2.3K $1.50, 11:39's ~12.8K $1.51, 11:59's ~81.4K $1.52 (touching the minimal chart's resistance), and 12:10's ~12.1K $1.54 (penetrating the minimal chart's resistance) ended this run-up period.
12:11-12:53 began a low/no-volume $1.51/3 on 12:11's 720 $1.52/3 (right at the minimal chart's resistance) and ended the period on 12:53's 205 $1.52.
12:54-15:03, after a no-trades two minutes, began a mostly very low/no-volume flat, down, flat, down ... series with a drop on 12:56's 2.1K $1.51, hit 13:17's 400 $1.48/9, 14:19's 810 $1.47/9, 14:49's ~5.6K $1.45/6, and 15:03's 960 $1.44 ended the period.
15:04-16:00, after a no-trades six minutes, started a weak attempt, based on very low/no-volume, to rise just as we've seen so many times on PR days and also on normal late-day volatility periods. It did 15:10's ~1.7K 1.45, hit 15:12's 300 $1.46, and 15:25's 10.6K $1.45->$1.48->$1.46. From here through the end it was essentially a very low/no-volume $1.46/8 and ended the period and day with a closing 400 sell for $1.46.
There two AH buys: 16:16 2K for $1.49; 17:34 a suspect 100 for $1.53, 7 cents above the close and 1 cent below the day's high.
Excluding the opening and closing trades (didn't qualify), there were 22 larger trades (>=5K & 7 4K+) totaling 195,955, 28.11% of day's volume, with a $1.4787 VWAP.
On the traditional TA front, movements were:
 Ending  Period  Period  Period __Per. Trade_ Period_ % Day_ Per. End
 Period  Volume     Low    High _Dollar Val._ VWAP___ Volume Buy ~%
On my minimal chart the big deal was closing below the rising support (rising orange line) on rising volume. It did not confirm a breakdown as today's PR reversed the move quite nicely, and on rising volume too, to close about midway between the rising support (rising orange line) and the resistance at $1.53. As mentioned yesterday, we are now in an area where the start of a head & shoulders pattern could develop. I noted it would be a bit raggedy though as we wouldn't have as much symmetry as is desirable. With today's PR, if there's any carry through there is a very short-term trade opportunity presented if it continues to develop. It is certainly high-risk IMO.__Open_ ___Low_ __High_ _Close_ Volume_
Today -4.14% 5.30% 6.21% 5.80% 25.27%
Prior 0.69% -2.22% -2.03% -4.17% 36.77%
Regarding "PR Pops" I typically expect a three-day cycle before the effects fade and "normal" behavior can be expected to begin telling the near-term story. With $CPST this has been less reliable than in some other stocks I watch.
On my one-year chart the 10-day SMA continues to decline and but did not begin to accelerate lower because we got a rise in trading range. We are beginning formation apotential right shoulder of an H & S pattern. Regarding the 20-day SMA, our range increase was insufficient to stop the decline which began yesterday. Unless we go to ~1.89 the decline will continue and accelerate now.
The 50-day SMA rate of rise should increase a bit if we just hold our range. Regardless of that, the rise is on track to continue for at least four more days if we just hold position.
The oscillators I watch, which yesterday had all but MFI (untrusted by me) weakening, switched to all improved today except accumulation/distribution. All are below neutral and everything is above oversold now.
The 13-period Bollinger limits, $1.3246 and $1.8000 ($1.3295 and $1.8459 yesterday) switched to converging as the lower limit began a rise. The mid-point is still falling as the upper limit decline rate is much higher than the lower limit's rate of rise.
All in, the rising volume and response to the support and resistance lines makes all this a believable near-term bullish pattern.

Percentages for daily short sales and buys moved in the same direction for the second consecutive day, unusual and welcome. The short percentage, still not known to be properly corrected, is barely above my desired range (needs re-check) and the buy percentage movement was marginal - call it unchanged. Further it's still well below what's needed for sustainable appreciation. Note my comment above about "selling into strength", which seems to be the case every time we get a PR now.
The spread is way too wide but was produced by the opposite of our usual. Today it was open low ago high, higher, higher, ... through ~12:15 before any sustained re-trace was seen. It was a much lower-volume over a longer time-frame re-trace too. This fits with my TFH-inspired push it up and sell into it but that's not germane right now as the numbers and method of production are telling the story. So I can't see the spread as suggesting near-term weakness.
VWAP movement added one positive to our negative trend, giving us now eleven negative moves in the last fifteen readings, meaning our positives went from three to four.
All in, I have to break my trend of near-term bearishness, regardless of buy percentage. Buy percentage will ultimately win out, but for the near term I believe the numbers suggest less negativism than normally. Adding in the volume and PR response, I think we've got another day or two in which we don't fall much. Maybe even a bit more up-side, but I expect our resistance is strong. Might only see a positive move in the VWAP getting another day or two of increase.
As always, much is experimental and should be treated as such.
Bill
Join the InvestorsHub Community
Register for free to join our community of investors and share your ideas. You will also get access to streaming quotes, interactive charts, trades, portfolio, live options flow and more tools.

