


Saturday, April 23, 2016 9:16:06 PM
Today I'm leery. I suspect some weakness will appear shortly. Details below, but first the infrequent "pat myself on the back" ...
Yesterday I noted { This suggests that there's not a lot of strength (yet?) in the move lower.In fact, our low today got almost exactly to a "reversion to the mean" point ( (5/14 high minus 4/13 low of $1.53) divided by 3 [ERROR s/b divided by 2] and added to that low). } I also suggested { Today gets us back to "normal" and, I think, sets us up for either a short consolidation or a resumption of the move up as the near-term profit-takers leave the space to the ones that are shooting for more.
Based only on this chart and those considerations my bias would be low downside risk and even some upside risk tomorrow. }.
I was apparently on one of my infrequent rolls as I also added { All in, there's too many positive indications to let the Bollinger suggestion carry too much weight. I'm cautiously suggesting we could rise again tomorrow, although there is some concern that we might not do so - could go flat easily or even drop. Less chance of that latter possibility I think. }
And I wrapped up discussion of my unconventional stuff with { ... but since we're not in a defined down trend I can't say it suggests more weakness near-term.
VWAP movement wasn't bad considering how much we rose the last few days. I can't read it as a big negative considering the circumstances. Likely just a result of some early profit-taking by a portion of the momo traders?
All in, I can't draw big negatives here, especially considering the reduction in the volume. }
Looks like I got a rare three for three on yesterday's prognostications.
There were two pre-market trades totaling 2.9K $1.99/$2.00.
09:30-10:07 opened the day with a sell of 3,292 for $1.98 and traded as low as $1.97 on another 746 shares followed by 9:31's ~19.3K $1.95->$1.92->$1.99. 9:36's ~9.2K $1.98/$2.00 kicked off a big run higher on low and high volume, hitting 9:46's ~2.6K $2.06/9, 9:49-:50's ~16.5K $2.12/15, 9:56's ~19.9K $2.13/8, 10:00's ~16.4K $2.16/24, 10:05's ~20.5K $2.22/7, and 10:07's ~2.4K $2.22/4 that ended the period.
10:08-11:06 began with 10:08's ~7.2K $2.24->$2.17, 10:09-:10's ~15.7K $2.17->$2.12->$2.19, 10:11-:13's ~6.7K $2.18->$2.16->$2.17->$2.22, 10:14's ~6.4K $2.18/20, and 10:16-:17's ~28.3K $2.20->$2.22->$2.19->$2.18->$2.22. Trading then switched to mostly medium volume, with some low/no-volume, falling to $2.16 by 10:27, rising to $2.27 by 10:38, and went sideways $2.19/$2.27 to end the period on 11:06's 2.5K $2.22/3.
11:07-12:24 began a long very consistent high/medium-volume climb up hitting 11:12's ~8.3k $2.32, 11:23's ~25.6K $2.39, 11:42's ~12.4K $2.44, 11:41's ~42K $2.48, 12:04's ~25.3K $2.62, 12:08's~20.7K $2.64 (followed by the first real dip, albeit small, to $2.58/61 before resuming the climb), and 12:24's ~11.1K $2.70 to end the period.
12:25-13:03 began a high/medium-volume trend lower with 12:25-:26's ~44.8K $2.69->$2.66->$2.65, moved back up on medium/high-volume to hit 12:32's 6K $2.64/7, started down hitting 12:38's ~27.7K $2.58/63, and 12:44-:45's ~79.7K $2.60->$2.61->$2.58->$2.53. Then we got 12:46-:48's medium/low-volume sideways $2.53/5, 12:49's ~7.5K $2.55-$2.60, 12:50-:13:01's low-volume sideways $2.55/61 narrowed to $2.55/7 at 12:55, and then dropped again on 13:02-:03's ~43.7K $2.55->$2.49 to end the period.
13:04-14:00 did 13:04-:15's medium/high-volume sideways $2.49/53, 13:16's~3/7K step up to $2.51/5, 13:17-:41's mostly low-volume sideways $2.51/5, and 13:42-14:00's mostly low-volume sideways $1.52/7 (with falling highs) to end the period on 14:00's ~1.3K $2.52/3.
14:01-14:31 began stepping lower on 14:01's ~30.1K $2.52->$2.53->$2.49, hitting 14:04's ~5.4K $2.45/7, 14:17's ~28K $2.43->$2.39->$2.41, got 14:18-:31's low/medium-volume sideways $2.41/4, with highs falling to end the period on 14:31's ~2.2K $2.41/2.
14:32-15:56 began a low/medium-volume step up hitting 14:37's ~8K $2.47/50, and 15:05's ~5.2K $250/2. 15:06's 31K $2.45/$2.52 kicked off another medium/low-volume sideways $2.47/52, and the period ended on 15:56's ~10.1K $2.49/50.
15:57-16:00 began a drop into the close with 15:57's ~7.9K $2.50->$2.47 and bottomed on 15:59's ~27.2K $2.47->$2.45->$2.46 and ended the period on 16:00's 7,137 $2.51.
There were 76 AH trades, $2.0500 - $2.5400 totaling 44,564. The last was another suspicious buy at 19:53:37 for $2.18 x 1,629 shares. Predicting tomorrow's early action?
Including the closing trade (opening didn't qualify), there were 67 larger trades (>=5K & 10 4K+) totaling 459,935, 21.27% of day's volume, with a $2.4699 VWAP. Considering today's volume I don't think this is excessive.
Notice that even as VWAP ascended buy percentage did not generally follow suit. Folks were selling or shorting into the rally in a big way (and hint, hint - check the short percentage below!).Ending Period Period Period __Per. Trade_ Period_ % Day_ Per. End
Period Volume Low High _Dollar Val._ VWAP___ Volume Buy ~%
10:07 166568 $1.9200 $2.2700 $353,365.28 $2.1214 7.70% 49.65% Incl 09:31 $1.9200 7,100 09:36 $1.9900 4,416
09:49 $2.1266 5,000 10:00 $2.2200 5,400
10:05 $2.2693 4,200 10:09 $2.1200 6,915
11:06 160744 $2.1200 $2.2700 $352,792.17 $2.1947 7.43% 46.78% Incl 10:17 $2.2000 5,547 $2.1941 5,547 $2.2000 8,280
10:43 $2.2309 5,000 10:51 $2.2202 5,479
12:24 700510 $2.2400 $2.7000 $1,732,401.39 $2.4731 32.39% 51.65% Incl 11:08 $2.2999 7,195 11:24 $2.2906 5,800
11:30 $2.3590 5,600 11:37 $2.3500 5,940
11:44 $2.4288 4,300 11:49 $2.3908 5,600
11:49 $2.3800 8,900 11:51 $2.4293 5,000
11:51 $2.4112 5,000 $2.4498 4,600 $2.4800 9,600
11:53 $2.4564 5,000 11:59 $2.4899 5,400
12:01 $2.5000 9,600 12:03 $2.5102 5,000
12:04 $2.5400 8,800 12:05 $2.6135 4,500
12:05 $2.6200 9,000 12:09 $2.6350 5,317
12:09 $2.6115 5,800 12:18 $2.5900 5,984
12:18 $2.6086 5,900 12:23 $2.6760 4,800
13:03 380797 $2.4900 $2.6900 $989,152.05 $2.5976 17.61% 49.83% Incl 12:25 $2.6750 8,500 12:26 $2.6800 5,000
12:26 $2.6013 5,400 12:27 $2.6500 10,500
12:30 $2.6102 5,800 12:35 $2.6500 5,700
12:36 $2.6500 10,000 12:39 $2.6199 9,000
12:44 $2.6000 11,600 12:45 $2.5800 20,160
12:50 $2.5699 8,000 13:00 $2.5700 5,000
13:02 $2.5540 4,500
14:00 171459 $2.4900 $2.5700 $432,273.06 $2.5211 7.93% 49.45% Incl 13:09 $2.5000 5,000 13:12 $2.5000 7,300
13:14 $2.5199 25,000 13:18 $2.5100 7,300
13:47 $2.5299 6,000
14:31 136861 $2.3900 $2.5250 $336,363.61 $2.4577 6.33% 47.76% Incl 14:01 $2.5200 5,100 7,587
14:06 $2.4637 5,400 14:07 $2.4800 5,321
14:17 $2.3910 9,400
15:56 333479 $2.4399 $2.5300 $833,303.07 $2.4988 15.42% 46.47% Incl 15:06 $2.4500 11,390 15:12 $2.5099 5,000
15:19 $2.5071 7,000 15:34 $2.5199 7,324
15:45 $2.5250 5,000 15:51 $2.5100 4,300
15:55 $2.5013 4,700 15:56 $2.4900 5,200
16:00 45540 $2.4500 $2.5100 $112,692.66 $2.4746 2.11% 46.23% Incl 16:00 $2.5100 7,137
19:53 44564 $2.0500 $2.5400 $98,049.52 $2.2002 2.06% 46.49% Incl 18:29 $2.2100 4,796
On the traditional TA front, movements were:
Considering the movement of the open and low, the movement of the high and close was impressive. And supported by good volume. However, I consider this suspicious for reasons of the new share issuance, suspected short selling by the "financiers" even before shares were in hand (see short percentage below), and the likelihood of momo traders getting manipulated by those that can move the market. Scroll back through these tweets on twitter back to ~4/11 or so and these on stocktwits (much more activity). Looks to me like positive feedback loops go on there.__Open_ ___Low_ __High_ _Close_ Volume_
Today -6.16% -1.54% 26.17% 24.88% 200.33%
Prior -0.47% 1.56% -10.84% -3.83% -69.28%
On my minimal chart the low was below yesterday's but the high was a rocket shot (see movements above) producing a very large spread that closed very high as well even though the open and low were both below yesterday's. Combined with the volume being quite high and rising this chart makes it look like there could be some strength left in the upward move. Add in that we began "pushing" my 13-period Bollinger band's upper limit again and some more upside seems even more likely. As before, the Bollinger mid-point is rising.
My only concern here would be what's not shown on the chart - the presence of the ATM. If CPST was hitting in the $1.4x range, which seems to have been borne out by price action matching my prediction of that, and possibly hitting it at even lower prices, it would seem to me foolish for them not to hit it at these elevated prices.
For that non-chart reason I'd be afraid to make a call for more upside near-term. So I'll go with my "neutral" wait and see mode.
On my one-year chart we broke through my long-term descending resistance, on the third day of trying I guess, and just need confirmation tomorrow.
All the SMAs continue to rise, as they should with the highest close we've seen in long time. And they are in order (10 > 20 > 50) and accelerating the rise - quite bullish.
The oscillators I watch are all improved, all above neutral and we have overbought conditions on RSI, MFI (untrusted by me), and Williams %R. ADX is +48, establishing a signal of consistency in rising prices. My only concern is that DI+ is 60, quite high, and makes me wonder if that combined with the overbought conditions are suggesting a re-trace might begin as momo folks certainly should be thinking of profit-taking in here. Might have started already. See my unconventional stuff's short and buy percentages below and the VWAP/buy percentages from the intra-day breakdown above.
When VWAP climbs while buy percentage weakens I think it suggests both price is being manipulated up and/or "selling into strength" is going on - possibly CPST hitting the ATM, among other possibilities.
The 13-period Bollinger limits, $0.9808 and $2.3469 ($1.0862 and $2.0676 yesterday) continues to rise, albeit a bit slower as the lower limit rte of decline is more closely matching the upper limit ascent. With it this wide now I suspect strongly that there is a strong possibility that a re-trace, to some degree, is in the near-term cards. The spread hasn't been this wide since late November of last year. If a move does develop ISTM it's got to be lower as that's where the mid-point lies - $1.6639.
N.B. My minimal chart's orange line, $1.69 lies just above that - let's call it $1.67-$1.70 to account for the other nearby tops. We could/should see strong support thereabout as all three highs occurred on good volume.
All in, I'm leery. Too many overbought indicators, too big a spread, volume over the last four days too variable to establish a volume pattern of strengthening or weakening, Bollinger mid-point a long way down, and maybe most important, that which is not on the chart, the presence of the ATM.
I would say near-term weakness but I'd be afraid it's a result of my jaded view, which took a long time to develop and won't be easily displaced, rather than what I can glean from the charts. However, given the concerns that are on the chart it's likely this time it's not a jaded-view induced conclusion.
So on this chart I cautiously say I think near-term weakness seems likely.
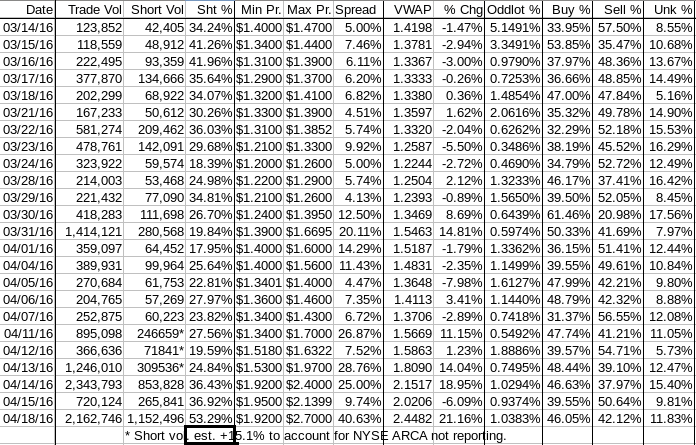
Percentages for daily short sales and buys moved n the same direction, suggesting normalcy, but that short percentage is well above my desired range (needs re-check) and the buy percentage doesn't jibe with what we saw in the intra-day VWAP changes and the ending VWAP. That would make sense with the daily short percentage being so high (and likely much higher as I bet ARCA was far above the 15.1% I estimate in my calculations).
The spread is absolutely outrageous today and was produced with a low open and rise through about 10:00, a brief re-trace and rise back up, a flattish period through about 11:00 and then a rocket shot to the day's high around 12:25.
This sort of behavior is abnormal and unsustainable IMO. It encourages momo traders to enter and exit quickly, which appears to have happened based on the intra-day VWAP and buy percentage conflicting behavior. This is supported, again, by the short percentage, which I suspect is much higher than my estimate.
VWAP movement: no complaint here - who doesn't love a rocket ride upward? However the fact that I love it doesn't mean I think it indicates strength. It's not a useful metric in isolation and I view it in light of short percentage, buy percentage, intra-day behavior.
All in, I think this move was a short-term end-point and expect weakness will shortly appear - those pesky buy and short percentages in light of the price action swaying my judgement in that direction.
As always, much is experimental and should be treated as such.
Bill
Join the InvestorsHub Community
Register for free to join our community of investors and share your ideas. You will also get access to streaming quotes, interactive charts, trades, portfolio, live options flow and more tools.

