


Saturday, March 26, 2016 8:56:01 AM
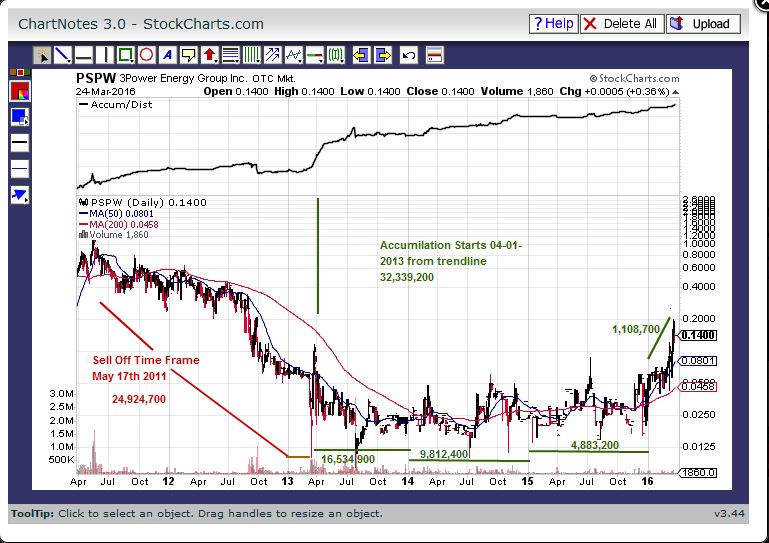
I was looking at the accumulation line on the PSPW chart the other day and noticed something obvious staring at me. When looking at the chart, I drew a visual trend line back to May of 2011 (boy do we remember those days). I looked at how long the stock sold off until April 2013, that’s where the stock reversed trend on accumulation.
This is where it gets interesting, (I wondered approximately how many shares sold off). I marked and ended the sell off date close to where accumulation started (The reverse trend). Then I pulled out the historical share trading volume from the time frames, and broke into year segments up to the first 3 months of this year.
Now we need to touch base on Enthalpy’s share breakdown analysis in the Ibox, which I have looked and believe is In line with what we have been told from the financial reporting’s.
The Company is authorized share are 300,000,000 common stock.
The Outstanding shares=249,949,923
The recorded issued shares from the financials = approximately 203,561,951 shares
(249,949,923-203,561,951) tradable= 46,387,972
I have always wondered to myself if any of those shares from the Seawind days were converted as we now watch how a little buying pressure effects this stock price. Look at the continued accumulation at the low and through Futures SF find, and draw your own conclusion from this.
(how much news have we had?)
I’m sure some of these shares have been flipped, but longs count on your fingers the number of shares that you’re personally aware of people holding. In simpler terms I believe the cup was emptied and the cup has been filled.
All this info was pulled from Yahoo Financials historical trading section.
I hope everyone has a great Easter weekend and be thankful and when you drink from the cup, I know what you will be thinking of.
Top/PSPW
Avant Technologies Equipping AI-Managed Data Center with High Performance Computing Systems • AVAI • May 10, 2024 8:00 AM
VAYK Discloses Strategic Conversation on Potential Acquisition of $4 Million Home Service Business • VAYK • May 9, 2024 9:00 AM
Bantec's Howco Awarded $4.19 Million Dollar U.S. Department of Defense Contract • BANT • May 8, 2024 10:00 AM
Element79 Gold Corp Successfully Closes Maverick Springs Option Agreement • ELEM • May 8, 2024 9:05 AM
Kona Gold Beverages, Inc. Achieves April Revenues Exceeding $586,000 • KGKG • May 8, 2024 8:30 AM
Epazz plans to spin off Galaxy Batteries Inc. • EPAZ • May 8, 2024 7:05 AM

