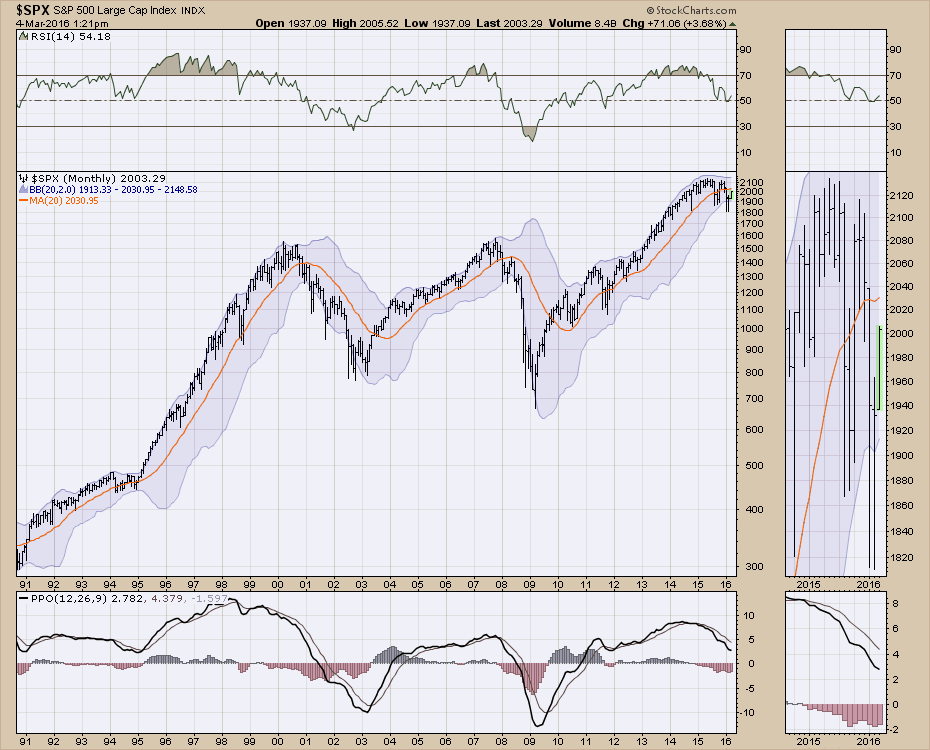
1 The RSI is the Relative Strength Indicator. As long as you are above 50, it is a bull market. When it dips below, you are in a bear market
2 when the market closed above the 20 MMA (Month Moving Average) shown as an orange line, we have been in a bull market
3 When you reach the top BB line, you are definitely in a bull market until the next time the price moves to the lower BB.
4 Downsloping PPO is pretty bearish. The histogram is a good signal. Until it starts to go positive, you have to respect that you are probably in a bear market.
Register for free to join our community of investors and share your ideas. You will also get access to streaming quotes, interactive charts, trades, portfolio, live options flow and more tools.
 News
News  Market Data
  Discover