


Thursday, February 04, 2016 9:02:04 AM
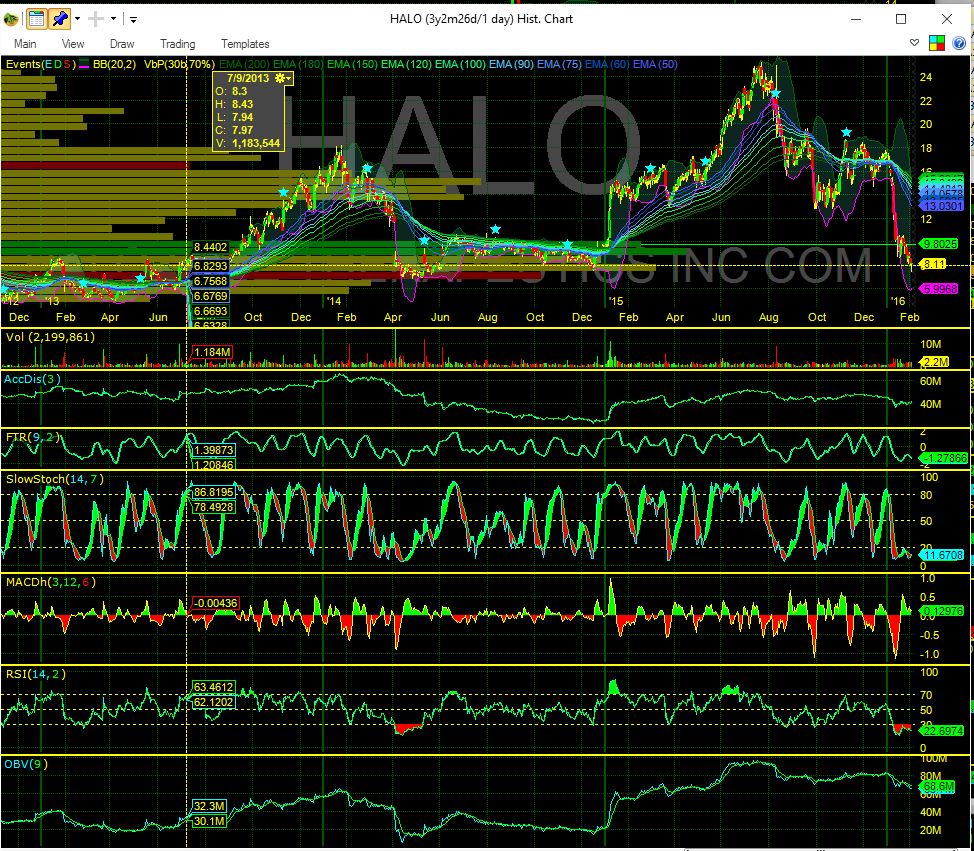
Daily chart shows the ebb and flow of the stock when the stock gets too far away from the ribbons it means the trend could easily reverse - see early 2014 and other examples. Greens are the long term EMA averages blues are the short term. Convergence means the stock is controlled tightly and trend could change quickly with the right news.
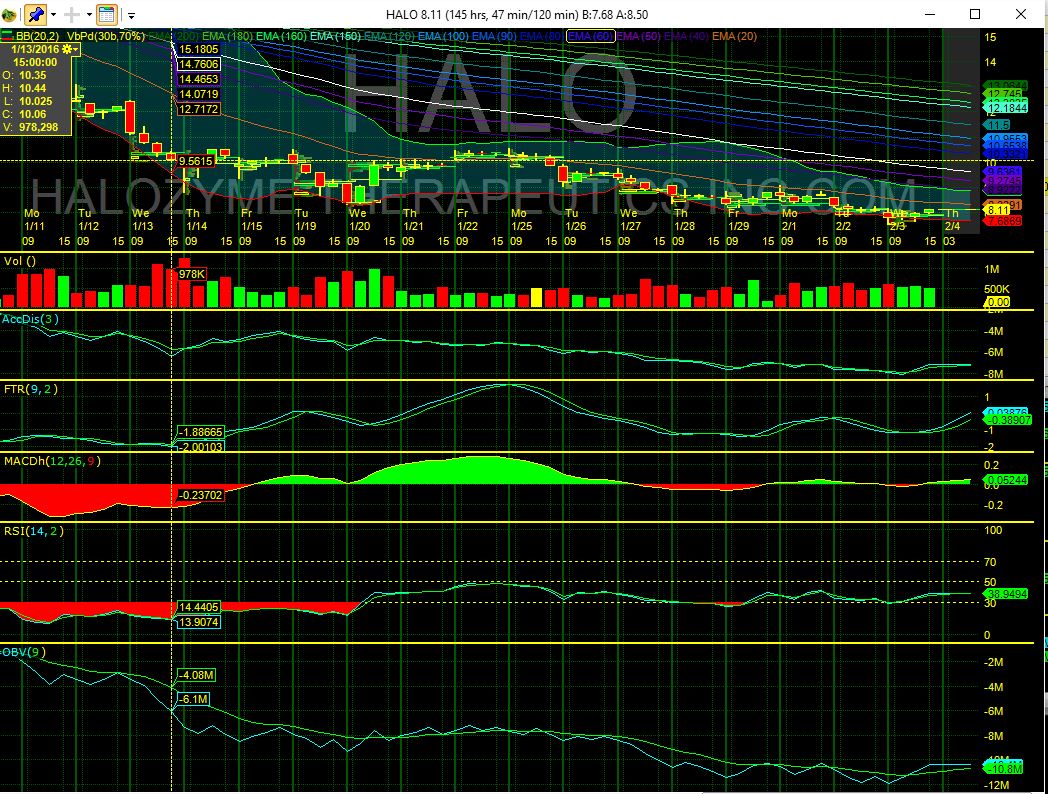
Here is a 120 minute ribbon chart. Our goal today to confirm reversal would be a break of the 20 period EMA that seems to control. See how it hugged the 20 and failed on the last run to $10.
The FTR is a good indicaton of which way the big boys are swinging and that is positive.

In Peace, In War
Recent HALO News
- Mahesh Krishnan Elected to Halozyme's Board of Directors • PR Newswire (US) • 04/25/2024 08:45:00 PM
- Halozyme to Report First Quarter 2024 Financial and Operating Results • PR Newswire (US) • 04/23/2024 12:30:00 PM
- Form PRE 14A - Other preliminary proxy statements • Edgar (US Regulatory) • 03/04/2024 09:13:48 PM
- Form 4 - Statement of changes in beneficial ownership of securities • Edgar (US Regulatory) • 02/28/2024 11:49:54 PM
- Form 144 - Report of proposed sale of securities • Edgar (US Regulatory) • 02/28/2024 09:07:37 PM
- Form 4 - Statement of changes in beneficial ownership of securities • Edgar (US Regulatory) • 02/27/2024 10:12:10 PM
- Form 4 - Statement of changes in beneficial ownership of securities • Edgar (US Regulatory) • 02/27/2024 10:05:35 PM
- Form 4 - Statement of changes in beneficial ownership of securities • Edgar (US Regulatory) • 02/27/2024 10:01:21 PM
- Form 144 - Report of proposed sale of securities • Edgar (US Regulatory) • 02/27/2024 09:08:09 PM
- Halozyme to Participate in Upcoming Investor Conferences • PR Newswire (US) • 02/27/2024 01:30:00 PM
- Form 4 - Statement of changes in beneficial ownership of securities • Edgar (US Regulatory) • 02/20/2024 11:59:00 PM
- Form 4 - Statement of changes in beneficial ownership of securities • Edgar (US Regulatory) • 02/20/2024 11:55:59 PM
- Form 4 - Statement of changes in beneficial ownership of securities • Edgar (US Regulatory) • 02/20/2024 11:53:11 PM
- Form 4 - Statement of changes in beneficial ownership of securities • Edgar (US Regulatory) • 02/20/2024 11:49:54 PM
- Form 10-K - Annual report [Section 13 and 15(d), not S-K Item 405] • Edgar (US Regulatory) • 02/20/2024 09:07:29 PM
- Form 8-K - Current report • Edgar (US Regulatory) • 02/20/2024 09:03:54 PM
- HALOZYME REPORTS FOURTH QUARTER AND FULL YEAR 2023 FINANCIAL AND OPERATING RESULTS • PR Newswire (US) • 02/20/2024 09:01:00 PM
- Form 4 - Statement of changes in beneficial ownership of securities • Edgar (US Regulatory) • 02/16/2024 10:47:15 PM
- Form 4 - Statement of changes in beneficial ownership of securities • Edgar (US Regulatory) • 02/16/2024 10:41:51 PM
- Form 4 - Statement of changes in beneficial ownership of securities • Edgar (US Regulatory) • 02/16/2024 10:39:34 PM
- Form 4 - Statement of changes in beneficial ownership of securities • Edgar (US Regulatory) • 02/13/2024 09:18:09 PM
- Form 4 - Statement of changes in beneficial ownership of securities • Edgar (US Regulatory) • 02/13/2024 09:15:51 PM
- Form 4 - Statement of changes in beneficial ownership of securities • Edgar (US Regulatory) • 02/13/2024 09:12:56 PM
- Form SC 13G/A - Statement of acquisition of beneficial ownership by individuals: [Amend] • Edgar (US Regulatory) • 02/12/2024 11:19:50 AM
- Halozyme To Report Fourth Quarter and Full Year 2023 Financial and Operating Results • PR Newswire (US) • 02/08/2024 09:30:00 PM
Bantec Reports an Over 50 Percent Increase in Sales and Profits in Q1 2024 from Q1 2023 • BANT • Apr 25, 2024 10:00 AM
Cannabix's Breath Logix Alcohol Device Delivers Positive Impact to Private Monitoring Agency in Montana, USA • BLO • Apr 25, 2024 8:52 AM
Kona Gold Beverages, Inc. Announces Name Change to NuVibe, Inc. and Initiation of Ticker Symbol Application Process • KGKG • Apr 25, 2024 8:30 AM
Axis Technologies Group and Carbonis Forge Ahead with New Digital Carbon Credit Technology • AXTG • Apr 24, 2024 3:00 AM
North Bay Resources Announces Successful Equipment Test at Bishop Gold Mill, Inyo County, California • NBRI • Apr 23, 2024 9:41 AM
Epazz, Inc.: CryObo, Inc. solar Bitcoin operations will issue tokens • EPAZ • Apr 23, 2024 9:20 AM

