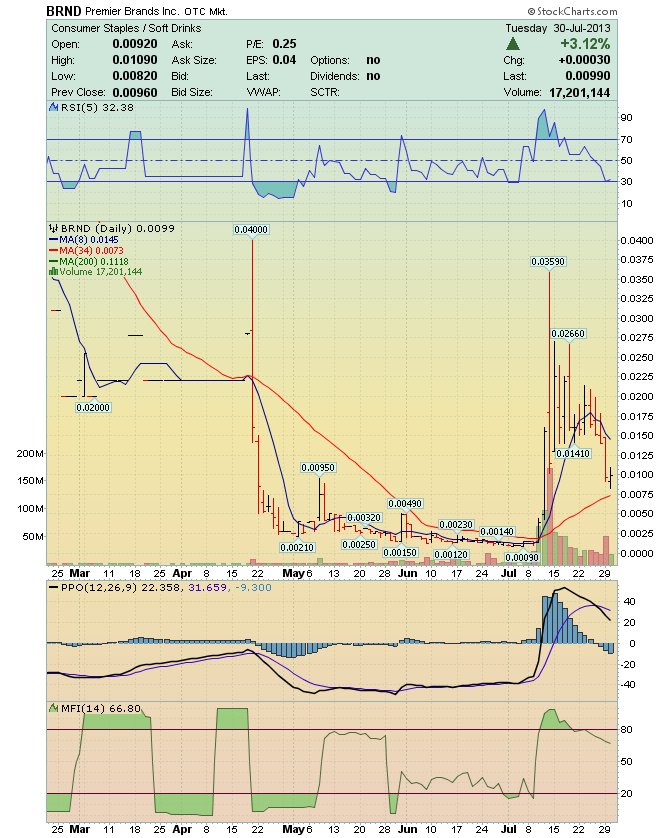
BTFL - BRND Chart Comparison - Pattern Analysis * Buy all of them at, the Point of Maximum Financial Opportunity ! Where is that ? At the end of an Elliott Wave 5-Wave Decline Sequence ! Elliott Wave Basics: abc corrective phase http://investorshub.advfn.com/boards/read_msg.aspx?message_id=86382765 http://i44.tinypic.com/w0ooe1.gif http://stockcharts.com/school/data/media/chart_school/market_analysis/elliott_wave_theory/ew_basics/ewb-06-thewdown.png http://stockcharts.com/school/data/media/chart_school/chart_analysis/fibonacci_retracemen/fibo-2-mmmretra.png http://stockcharts.com/h-sc/ui?s=BTFL&p=D&yr=0&mn=3&dy=20&id=p44913585936 http://images.investorshub.advfn.com/images/uploads/2014/6/15/dczhpBRND_Chart_2.png http://stockcharts.com/c-sc/sc?s=BTFL&p=D&yr=0&mn=3&dy=20&i=p44913585936&r=1451380332700
 News
News  Market Data
  Discover