


| Followers | 689 |
| Posts | 143817 |
| Boards Moderated | 35 |
| Alias Born | 03/10/2004 |
Sunday, October 04, 2015 10:32:23 AM
I'm Not Convinced By Friday's Rally. Are You?
* October 4, 2015
Friday's market action is causing quite a buzz in the financial analysis world. After the "meh" US jobs report came out Friday morning, stocks gapped down sharply at the open but then rallied throughout the day and finished up roughly 1.5% (depending on which index you use to track things). The optimists out there are proclaiming that "The Bull Market is Back!" I think that sentiment is very premature. Here's why:
1.) We are still well under the 50- and 200-day moving averages.
Here's a chart of the Dow with some perspective:
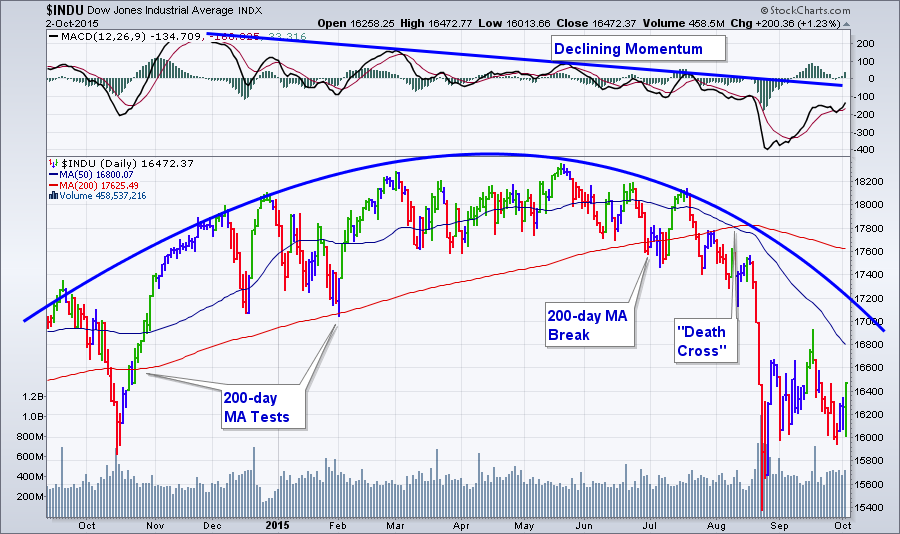
The thick blue line is a rounding top formation that formed after the Dow's multi-year uptrend extending back to 2011. The thinner red and blue lines are the 200-day (red) and 50-day (blue) moving averages. As you can see, those key averages are still above the Dow and moving lower. The good news is that the distance between the Dow and its 50-day MA is rapidly decreasing, but before we can even begin to think about becoming bullish on stocks again, the Dow must move above that line.
2.) The Dow's momentum is still negative.
The MACD line at the top of the chart above continues in a downtrend extending back to 2014. Now, some good news has started to appear on that part of the chart as well - the MACD line moved higher for most of September - however, it is still in negative territory and still has not moved above the blue downtrend line. Both of those things need to change as well.
3.) We are still well under the intermediate term downtrend line from the beginning of August.
Here's a chart that zooms in on the most recent part of the Dow chart above:
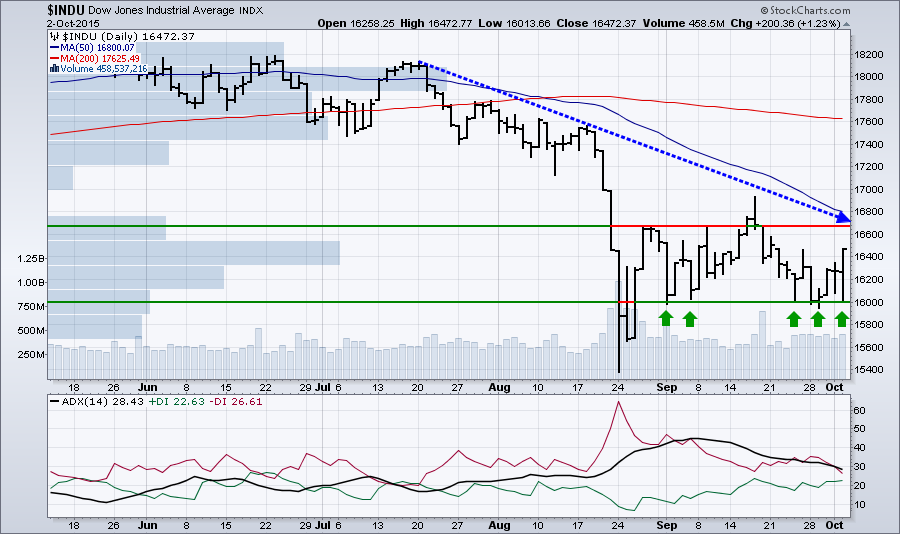
The blue dashed line is the key downtrend line that the Dow needs to break before anyone can talk seriously about big uptrends.
4.) The markets bounced when the Dow touched 16,000 - just like they did 4 times before
The green arrows in the chart above show those bounces. There's nothing currently to suggest that Friday's bounce is any different from the previous ones.
5.) There's a lot of overhead resistance weighing on the Dow
Do you see the long "Volume by Price" bar sticking out of the left side of the chart near the 16,500 level? That represents all the trading volume that has happened at that level since the start of the chart. It is essentially a gauntlet of selling pressure that the Dow needs to get through convincingly before it can move higher. The combination of that resistance, the downward trendline and the downward 50-day moving average (often considered a dynamic trendline) may create a "perfect storm" of resistance that pushes the Dow back down to 16,000 - and possibly lower.
6.) The sector rotation picture doesn't support the idea of a big bull move right now
The sector picture is a mess right now. The biggest gaining sector on Friday was Energy stocks - a sector that typically does well at the end of a big bull run. At the other end of the spectrum, Financial stocks were crushed on Friday - they didn't recover like the rest of the market. That's not good either because, at the end of an important downward move, financial stocks should be outperforming the other sectors. We really want to see Financials, then Cyclicals, then Technology stocks show lots of relative strength. When that happens, it means that the market really is ready to power higher based on a strong economic picture.
There is a glimmer of good news on the sector front - many of the top Large Cap SCTR stocks right now are Cyclical stocks such as NetFlix, Activision, Amazon and Advance Auto Parts. Hopefully, the Cyclical sector itself will continue to strengthen.
So, was Friday's rally a bad thing for the bulls? Absolutely not. But it is going to take much more than 6.5 hours of optimism to convince me things are going to move significantly higher soon.
Take care,
- Chip
http://stockcharts.com/articles/chartwatchers/2015/10/im-not-convinced-by-fridays-rally--are-you.html
• George.
Information posted to this board is not meant to suggest any specific action, but to point out the technical signs that can help our readers make their own specific decisions. Your Due Dilegence is a must!
• gtsourdinis
Join the InvestorsHub Community
Register for free to join our community of investors and share your ideas. You will also get access to streaming quotes, interactive charts, trades, portfolio, live options flow and more tools.

