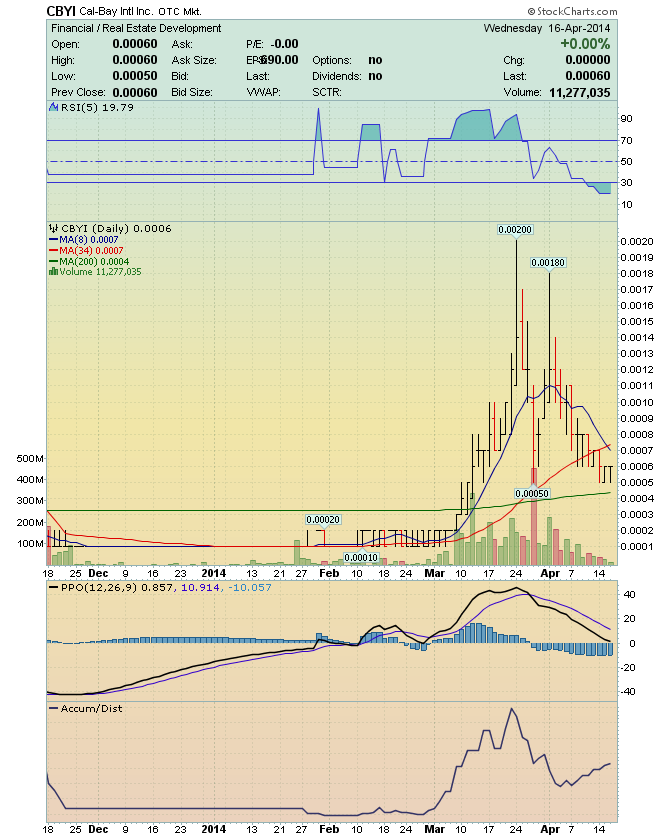
MDCE - CBYI - PMBS Chart Comparison Analysis Note: PPO Lines Note: The stocks recover, after Flat-lining at Bid 0.00 Ask 0.0001 http://stockcharts.com/h-sc/ui?s=PMBS&p=D&yr=0&mn=6&dy=28&id=p91961217938 http://stockcharts.com/h-sc/ui?s=MDCE&p=D&yr=0&mn=7&dy=17&id=p88970630897 http://images.investorshub.advfn.com/images/uploads/2014/4/17/wpyceCBYI_Chart_13_from_0.0001_to_0.002.png http://stockcharts.com/c-sc/sc?s=PMBS&p=D&yr=0&mn=6&dy=28&i=p91961217938&r=1432889868816 http://stockcharts.com/c-sc/sc?s=MDCE&p=D&yr=0&mn=7&dy=17&i=p88970630897&r=1432889878210
 News
News  Market Data
  Discover