the data on the right is the data that the program used when back-testing. In the XIM examples, it can be either real Yahoo-adjusted XIV data, or simulated data based on the site I mentioned.
This example was meant to show a specific strategy where one puts most the portfolio in safe assets and the rest in extremely volatile instruments like options. I chose VIX for testing, and used real data and simulated data to be able to go back 10 years.
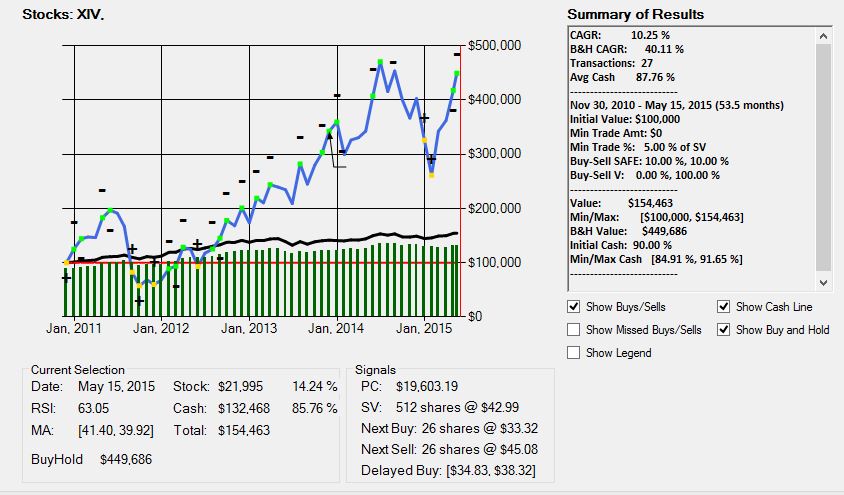
Here is a breakdown of the user interface:
The right side shows results and the overall settings used.
The bottom panel shows the signal based on the current selection. The current selection goes back and forth in time to show what-if scenarios.
For instance, in the example:
I have the cursor placed pretty much at the right most side (not the vertical red line?), and it reads as follows at the close of May 15:
- the stock's RSI was 63.05 - the 13-day and 30-day moving averages were 41.4 and 39.92, respectively - Stock Value was 21,995, cash 132,468, for a total total value of 154,463 - Buy and Hold would've been 449,686 - PC was 19603, SV 512*42.99 (= 21,995) - Buy signal: 26 shares @ 33.32 - Sell signal: 26 shares @ 45.08 - Delayed AIM is to assess when AIM would actually stop buying, either based on the buy amount being below the min trading amount, or on it completely stop buying (Ocroft refers to this as "PC stop rising"). This is only applicable if one wants to trigger a actual buy after a series of non-executed buys
Register for free to join our community of investors and share your ideas. You will also get access to streaming quotes, interactive charts, trades, portfolio, live options flow and more tools.
 News
News  Market Data
  Discover