


is now calling for Germany to make reparations -
of some fiat$250 billion because of what the Rothschild/Nazis did -
75 years ago to Greece -
(next in reparation line: Italy, Spain, Portugal, France, England etc. (fiat$trillions) etc.
etc. luc. Rothschild to plunder US people's fiats taxes & all fed. cent.
666 banks etc. - ? -
(later reparation lines will be: Vietnam, Iraq, faar east etc. ? etc.)
the gold is gone -
to new 666 vaults in China)
http://www.ino.com/blog/2015/02/greece-nazis-and-3-strong-sectors/#.VNpDkkfF-So
LT Gold chart below -
Alan Greenspan talks GOLD -
https://www.youtube.com/watch?v=Oz4-Tru_30A
monthly chart for gold/
http://investorshub.advfn.com/boards/read_msg.aspx?message_id=110657761
http://politicalvelcraft.org/?s=gold
old Au treasure chest -
http://investorshub.advfn.com/boards/read_msg.aspx?message_id=110657558
$GOLD chart TA P&F bullish price objective $1570/oz next target -
God Bless
Ps.
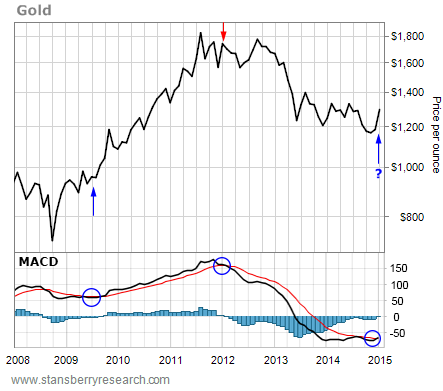
excerpt/ 1n 2011 gold topped out/ Gold Is On The Verge Of A Major 'Buy'
Signal
Gold has been on fire.
Over just the past four weeks, the price of gold is up $110 per ounce.
That's a gain of almost 10%. It's one of the best monthly performances
for the metal since the price peaked back in 2011.
If gold can hang onto these gains over the next week, we'll have the first
long-term buy signal for the metal since mid-2009.
And it could lead to big gains in the price of gold...
Take a look at this long-term monthly chart of gold
with its Moving Average Convergence Divergence (MACD)
momentum indicator...
[-chart]files.growthstockwire.com/images/tV-79190318_3G7XKS4TY9.png[/chart]
MACD indicator is often used for determining overbought and oversold conditions.
But it can be used as a long-term timing indicator, too.
Without getting too complicated, when the black MACD line crossed above
the red MACD line, we have a "buy" signal.
When the black line crosses below the red line,
we have a "sell" signal.
The first blue arrow on the chart shows the last major buy signal
from the MACD indicator.
That kicked off a long-term rally in gold.
The price gained more than 100% in just two years.
The red arrow on the chart shows the last MACD sell signal.
That downturn has lasted three years so far.
And prior to this month's rally, gold had fallen almost $600 per ounce –
roughly 30%.
But it looks like the decline has ended.
Last week, the black line on the MACD indicator crossed above the red line.
That's a buy signal.
And it could lead to huge gains in the price of gold over
the next several months.
monthly chart. All that matters is how things look at the end of the month
– which is still a few days away.
If the price of gold declines this week, then the black line on
the MACD indicator may turn back down and end the month below the red
line.
That will mean the downtrend remains intact, and it'll be
at least another month before we can get a buy signal.
On the other hand, if gold can hang on to its recent gains –
or even add to them – we'll end the month with a
new long-term buy signal for gold.
It will be the first major buy signal since 2009.
And it should lead to much higher gold prices.
by mick thank you -
God Bless

My opinions are my own and and DD I post should be confirmed as unbiased
North Bay Resources Commences Operations at Bishop Gold Mill, Inyo County, California; Engages Sabean Group Management Consulting • NBRI • Sep 25, 2024 9:15 AM
CEO David B. Dorwart Anticipates a Bright Future at Good Gaming Inc. Through His Most Recent Shareholder Update • GMER • Sep 25, 2024 8:30 AM
Cannabix Technologies and Omega Laboratories Inc. Advance Marijuana Breathalyzer Technology - Dr. Bruce Goldberger to Present at Society of Forensic Toxicologists Conference • BLOZF • Sep 24, 2024 8:50 AM
Integrated Ventures, Inc Announces Strategic Partnership For GLP-1 (Semaglutide) Procurement Through MedWell USA, LLC. • INTV • Sep 24, 2024 8:45 AM
Avant Technologies Accelerates Creation of AI-Powered Platform to Revolutionize Patient Care • AVAI • Sep 24, 2024 8:00 AM
VHAI - Vocodia Partners with Leading Political Super PACs to Revolutionize Fundraising Efforts • VHAI • Sep 19, 2024 11:48 AM

