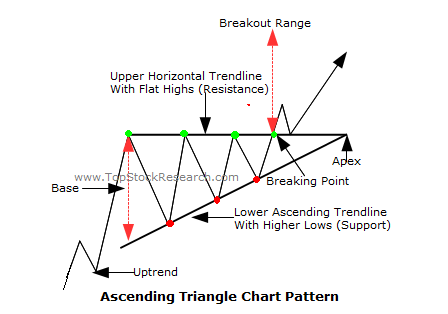
TVIX & SPX chart analysis Check this out! SPX recent triple top at 2064 and creating lower lows(descending triangle) = BEARISH images.investorshub.advfn.com/images/uploads/2015/2/5/blflpsc_(1).png images.investorshub.advfn.com/images/uploads/2015/2/5/hdxdhtriple-top-chart-pattern.png TVIX flat highs and creating higher lows(ascending triangle) = BULLISH images.investorshub.advfn.com/images/uploads/2015/2/5/pesybsc_(2).png images.investorshub.advfn.com/images/uploads/2015/2/5/zuwolAscendingTriangleSampleImage.png


 News
News  Market Data
  Discover
.png)

.png)