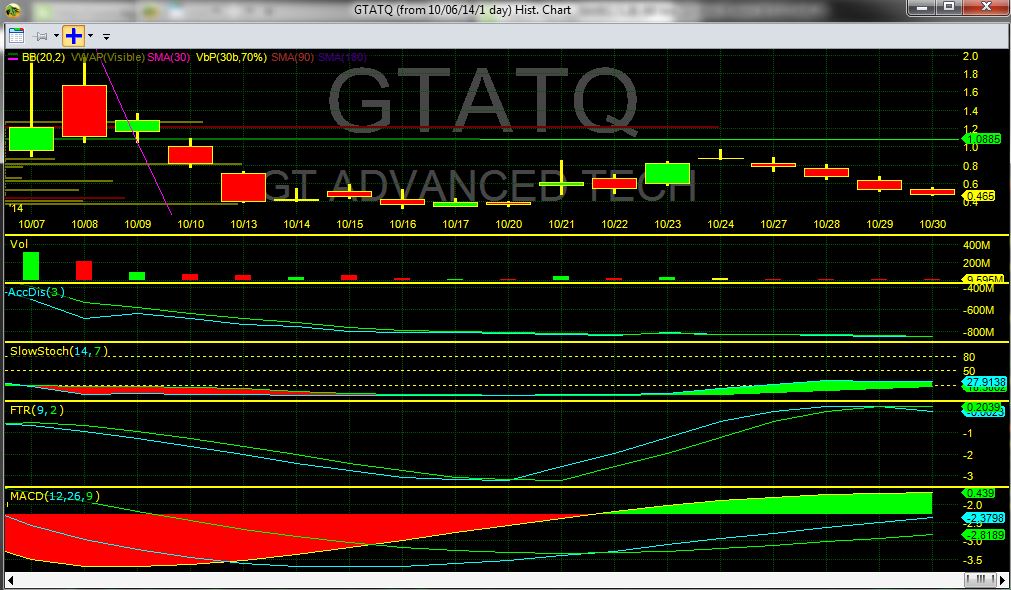
This chart is from the day after the "BIG DUMP" to current.
Notice declining volume- making it difficult for anyone who is still short to cover.. Ahem.... don't tell me there are no shorts - the stock hit threshold recently.
Notice that A/D is neutral. A 300% change in price with no A/D impact? Can you spell W-A-S-H T-R-A-D-I-N-G?
Slow Stoch indicates big boys are still accumulating.
FTR- is doing the wild thing.
MACD has been positive since the 21st?
So please, what part of that chart is negative? What part is positive?
Register for free to join our community of investors and share your ideas. You will also get access to streaming quotes, interactive charts, trades, portfolio, live options flow and more tools.
 News
News  Market Data
  Discover