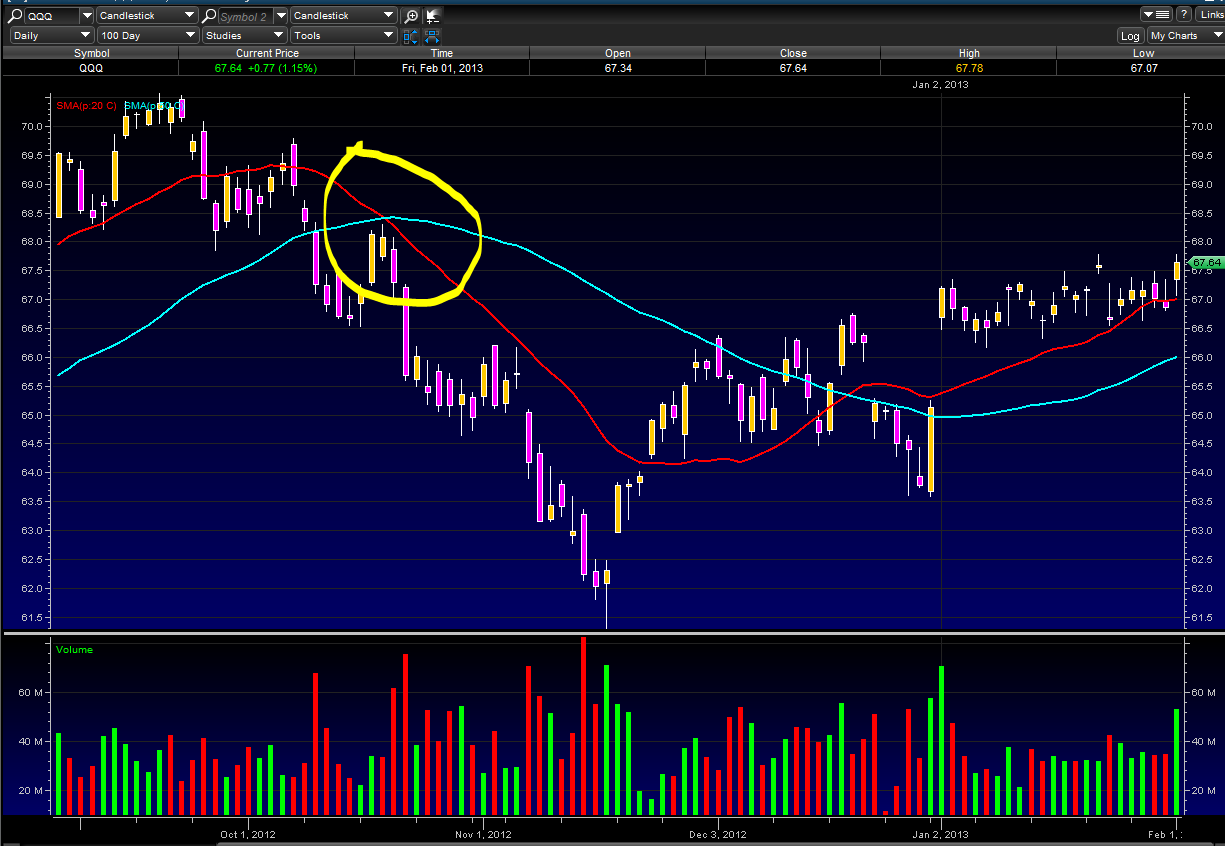
A Death Cross is when a shorter term moving average crosses below a longer term moving average, for example a 20 day SMA crossing under a 50 day SMA. A death cross indicates a bearish trend, especially when it is coupled with higher trading volume. As well as being a trend indicator, the longer term moving average becomes a resistance line as the price rises. The chart below shows a 20/50 SMA Death cross: 20 SMA is in Red 50 SMA is in Blue
Register for free to join our community of investors and share your ideas. You will also get access to streaming quotes, interactive charts, trades, portfolio, live options flow and more tools.


 News
News  Market Data
  Discover