"Rest assured that I've looked at a lot of charts "behind the scenes" over the past 48-hours, but to keep things as simple-to-follow as possible, I'm only going to publish three charts.
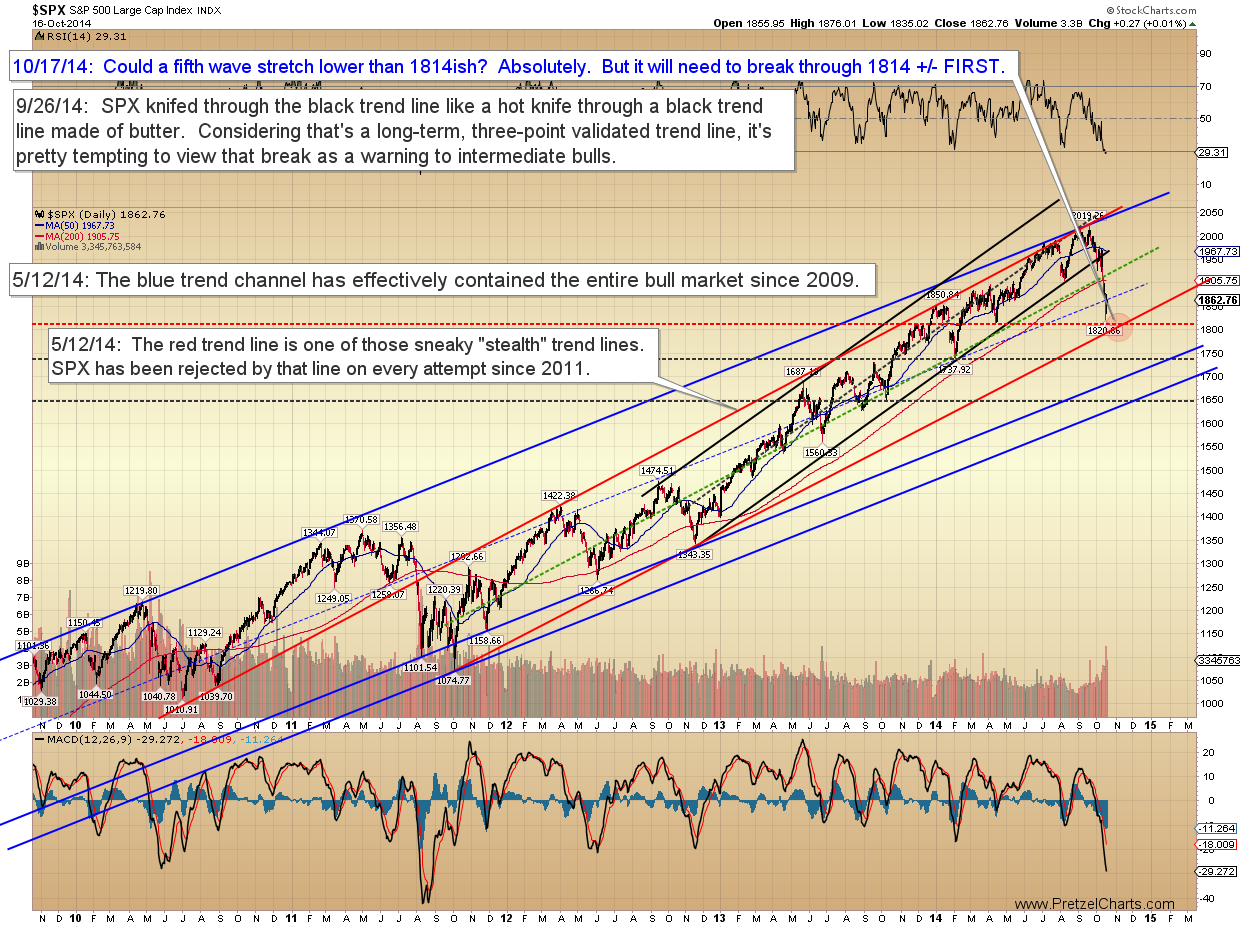
Wednesday was a good session for bears, as SPX captured its preferred target zone of 1824-33 (low of 1820.66), which was good for about 100 points of profit in four sessions. We hit the intermediate turn well, and we've captured the lion's share of this decline off the all-time high, but now it's time for a little humility. I'll discuss why below.
Let's start with the simplest wave count. The first question we have to ask ourselves is if we believe this decline will be an ABC or a five-wave impulsive decline at higher degree -- and the honest answer is that no one knows for certain. By all rights, momentum and most other indicators suggest that the final bottom isn't in yet, so odds favor new lows to come. Therefore, we can make the assumption that we're in wave (4)-up with (5)-down to come, but we do have to remain aware that this is only an assumption.
For the record, the gray path to "or (4)" shown below would be my "perfect world" outcome here, as follows: A quick pop today, followed by a decline that breaks the prior low (probably finding support near 1814) then a sudden rally up toward 1898 +/-, and then another decline to new lows."
"The question bears will ask is why I have wave (5) labeled near 1814, because that's far too short for typical Elliott Wave expectations. I'll answer that with the daily chart below. Note that the gray path I outlined above would work as one solution to resolve these conflicting market pressures."
"The near-term chart is a little more complex.
On Wednesday, I published the following chart in our forums, and I'd like to update it and make it public now. This chart has the potential to be a bit confusing, but suffice it to say that during Wednesday's session, I began viewing the last decline as (yes, another) extended fifth wave. Be aware that red 5 of (3)/C does not end at blue 1 -- in this count, blue 1 is actually the first wave of red 5 (thus wave 3 is not the shortest wave)."
"In conclusion, to keep things as simple as possible with the market in a very complex position: My perfect world outcome would be the gray path shown on the first chart. That could always be blown up as early as today's session, though, so I've outlined some additional signals and levels on the 10-minute chart. Trade safe."
Register for free to join our community of investors and share your ideas. You will also get access to streaming quotes, interactive charts, trades, portfolio, live options flow and more tools.
 News
News  Market Data
  Discover