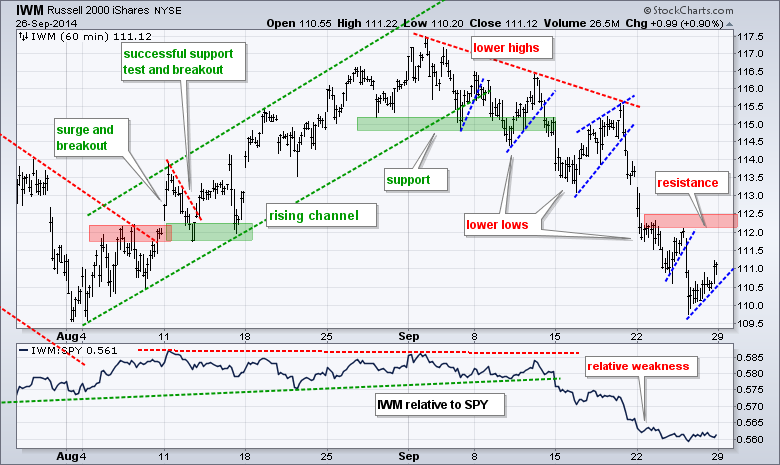
IWM 60 BY ART HILL . It is just one failure after another on the IWM chart. The ETF peaked at the beginning of September and moved lower with a series of failed rallies (dotted blue trend lines). Each bounce resulted in a lower high and each trend line break led to a lower low. I will mark resistance at last week's highs (112-112.5). The indicator window shows the IWM:SPY ratio breaking down in mid September and remaining weak as small-caps underperform large-caps
Register for free to join our community of investors and share your ideas. You will also get access to streaming quotes, interactive charts, trades, portfolio, live options flow and more tools.
 News
News  Market Data
  Discover