The set up coming into this week was squarely bearish: SPY up against a verified resistance line, a break in RUT below 1160, poor seasonality, a likelihood for higher Vix, rising equity put/call ratios and a spike higher in Skew all suggested a downside edge (post). In the event, markets had their largest sell off in two months.
The week ahead is not as clean. Surprisingly, after just 3 days of selling from an ATH, a number of breadth indicators became oversold. On the one hand, the current bull market is nothing if not persistent, which favors further upside. On the other, strong down momentum, as seen this week, usually takes more time to dissipate, and this favors a continuation lower, even if just to retest the Thursday low.
Let's review the facts:
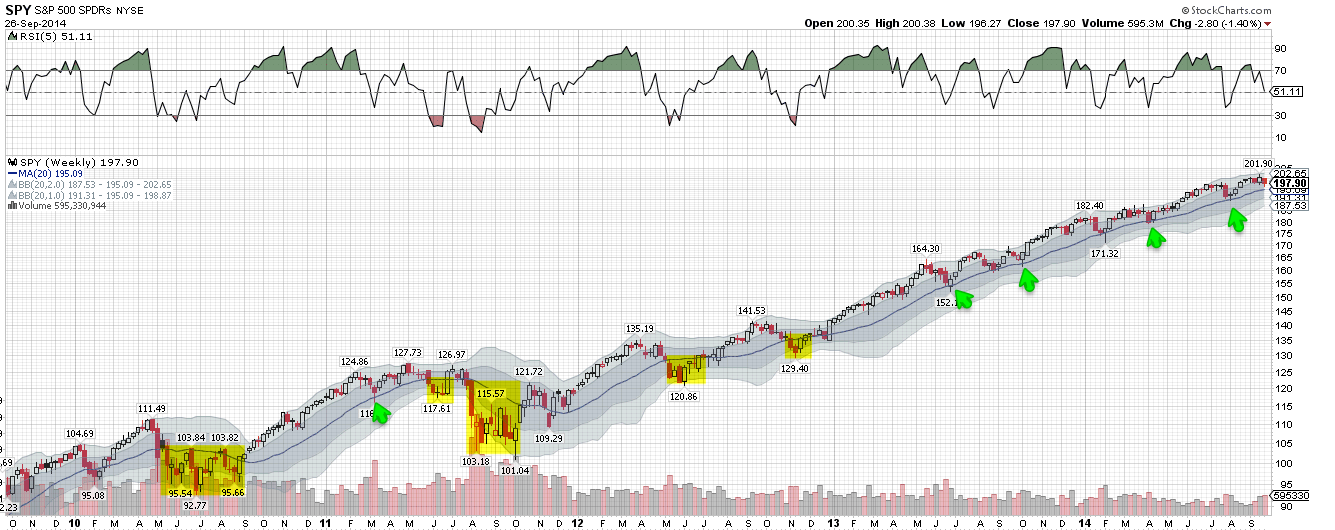
The longer term trend in SPY remains intact despite this week's retreat. Recall that SPY made a new ATH just a week ago. It's now down one week. SPY has not been down two weeks in a row since January. On the weekly chart, SPY remains in a strong uptrend until its 20-wma (blue line) is breached.
The 20-wma is now at 195. A close below, based on the past, would likely lead to the aforementioned touch of the lower Bollinger, at 187.5. From the recent high, that would equal a 7% drop.
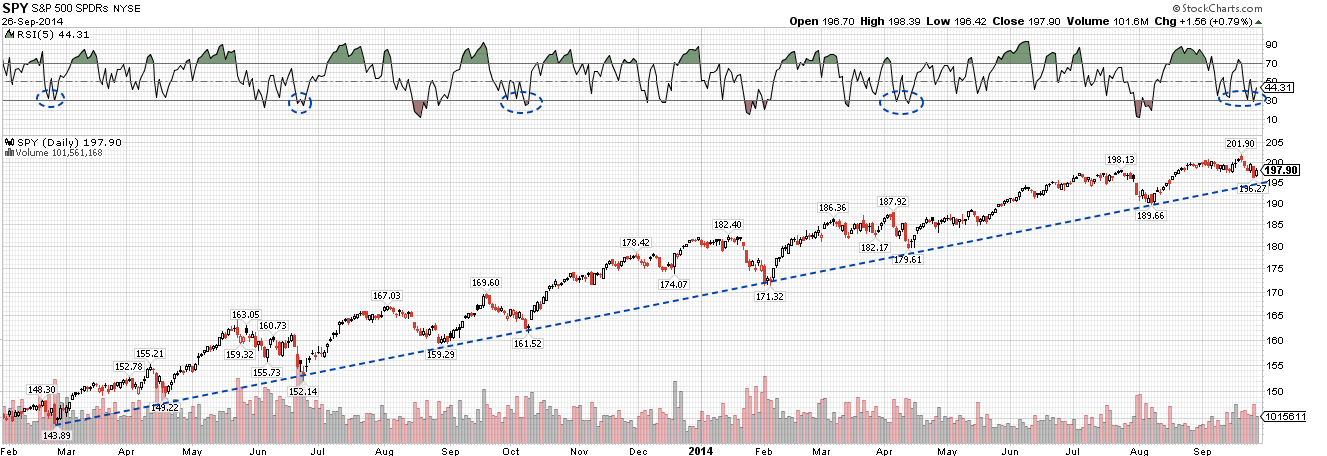
The 195 level is also important on shorter time frames. On the daily, this marks a key uptrend from the March 2013 low. This line has not been breached in 18 months. Note the pattern in RSI (top panel): weakness in the coming week(s) to 195 would resemble April 2014 and October 2013.
On the hourly chart, 195 corresponds to a trend line from February as well as trading lows during July. The rally on Friday leaves the short term pattern unclear. Note the two trading ranges highlighted in yellow. SPY ended the week between them without first touching the 195 area. There's a series of lower highs and lows from last week and the falling 5-dma (green line) ended the rally on Friday as it did on Wednesday. On balance, a return to the low seems more likely, but it's far from clean. Note that a gap from mid August would fill at 194.8.
Tipping the scales in favor of continued weakness is that the 13-ema is downtrending for all four US indices, suggesting that the short term trend is weak. We will be watching for an inflection higher to confirm the reversal.
The strong selling on Thursday produced a number of extremes in breadth. Most of these suggest the bottom is either in or close. Let's look at each in turn.
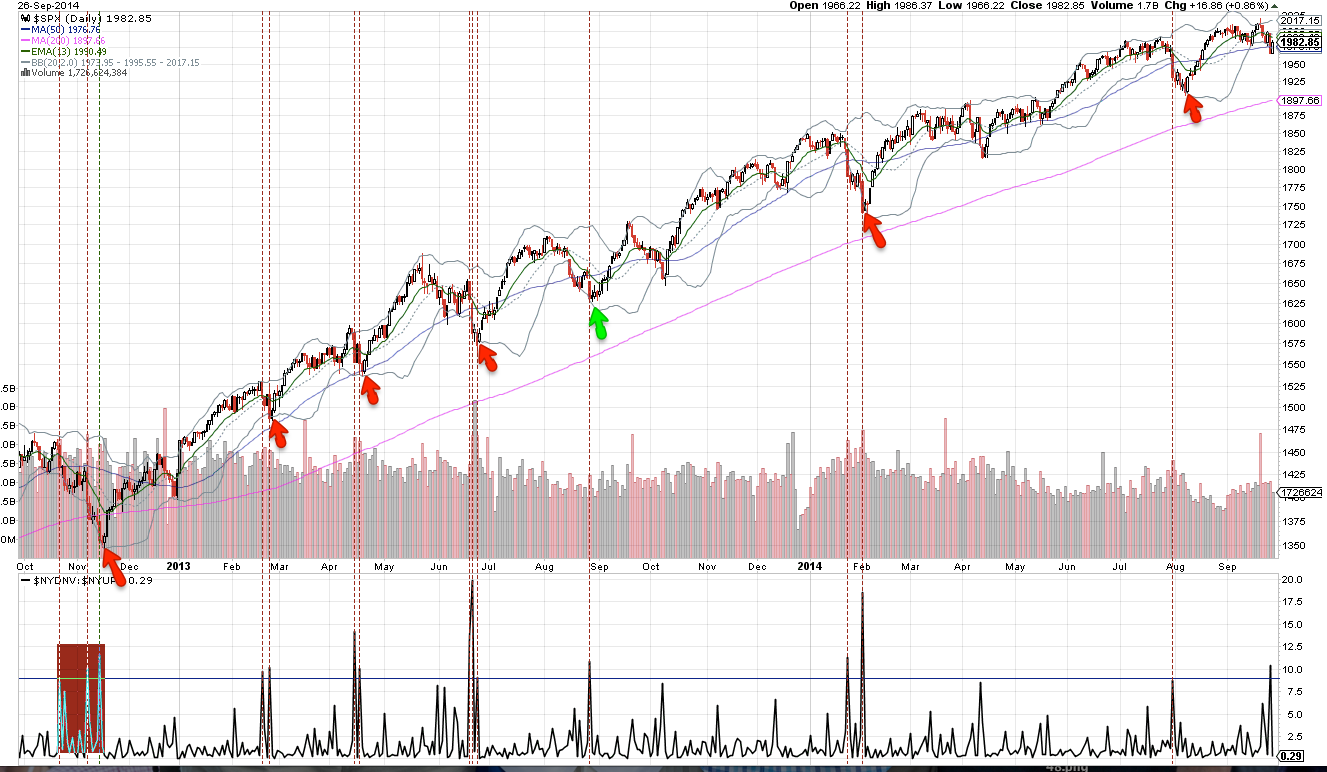
First, down volume on Thursday was 10 times greater than up volume, making a so called major distribution day (MDD). This indicates significant downward momentum. In the past, this has carried the indices down a bit further in the next few days into a low. This suggests some more selling before the ultimate low. There was only one exception in the past two years and this occurred after a month of selling (green arrow).
Dana Lyons also looked at MDDs when they occur, as this one did, near a relative peak in SPY. Returns ahead were weaker than after MDDs occurring at a low. This makes sense as a MDD typically is sign of exhaustion which, near an ATH, would be unusual. Dana's full post is here.
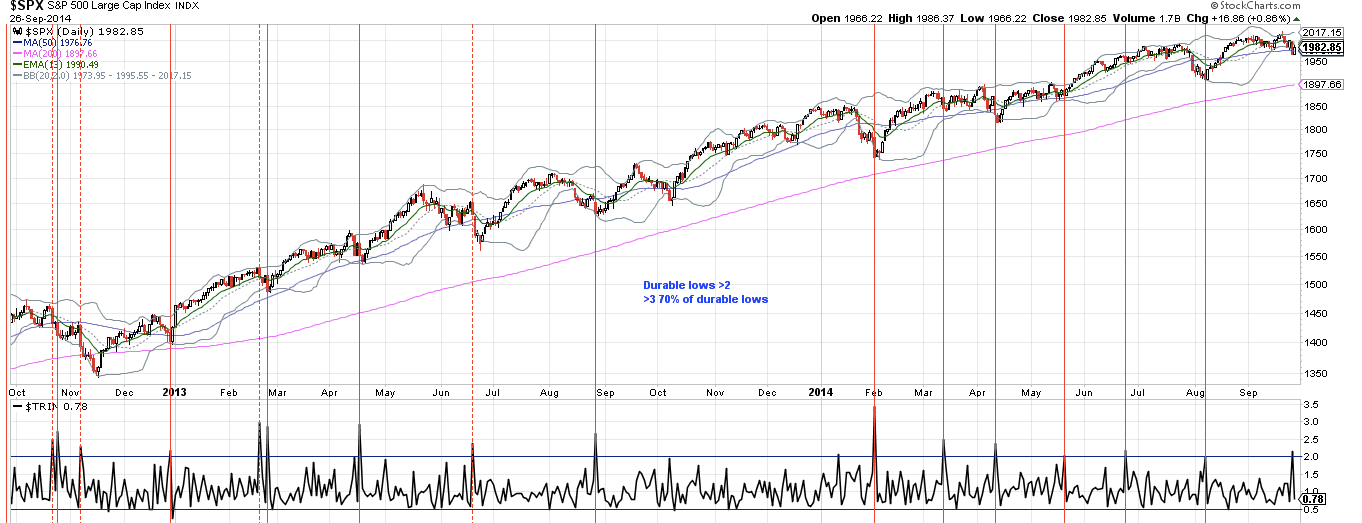
Second, we commented on weakness in breadth last week. At this week's low, 20% of SPX companies were above their 20-ema and 37% above their 50-ema. In the chart below, note that nearly every low occurred after the percent above their 50-ema reached 30% (arrows). It's possible that SPX will bounce or trade sideways for a week before making that low. The point again is that downward momentum usually takes time to dissipate. April 2014 was one of only two exceptions in the past 4 1/2 years.
The 10-day average of the SPX cumulative advance-decline line also reached an extreme on Thursday. Like the studies above, this indicates a low is near but there is usually a bit more selling as momentum dissipates (chart from Bespoke).
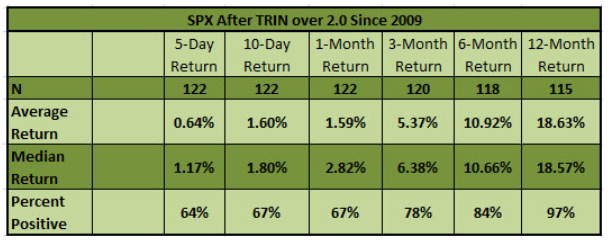
Thursday also created a spike over 2 in Trin (the advance-decline ratio for issues divided by that for volume). Of the studies we looked at, this is the most squarely bullish. A high Trin last occurred at the August low and marked the bottom to the day (post). As we noted then, the biggest failures in Trin being close to the low have been when stocks have been rising in the prior week. That was not the case on Thursday. The spike in Trin and the jump in SPX on Friday might well indicate that a low was made.
According to Ryan Detrick, SPX has been higher one and two weeks later ~66% of time after a spike in Trin over 2.
Register for free to join our community of investors and share your ideas. You will also get access to streaming quotes, interactive charts, trades, portfolio, live options flow and more tools.


 News
News  Market Data
  Discover


.png)
