


Monday, August 04, 2014 10:11:04 PM
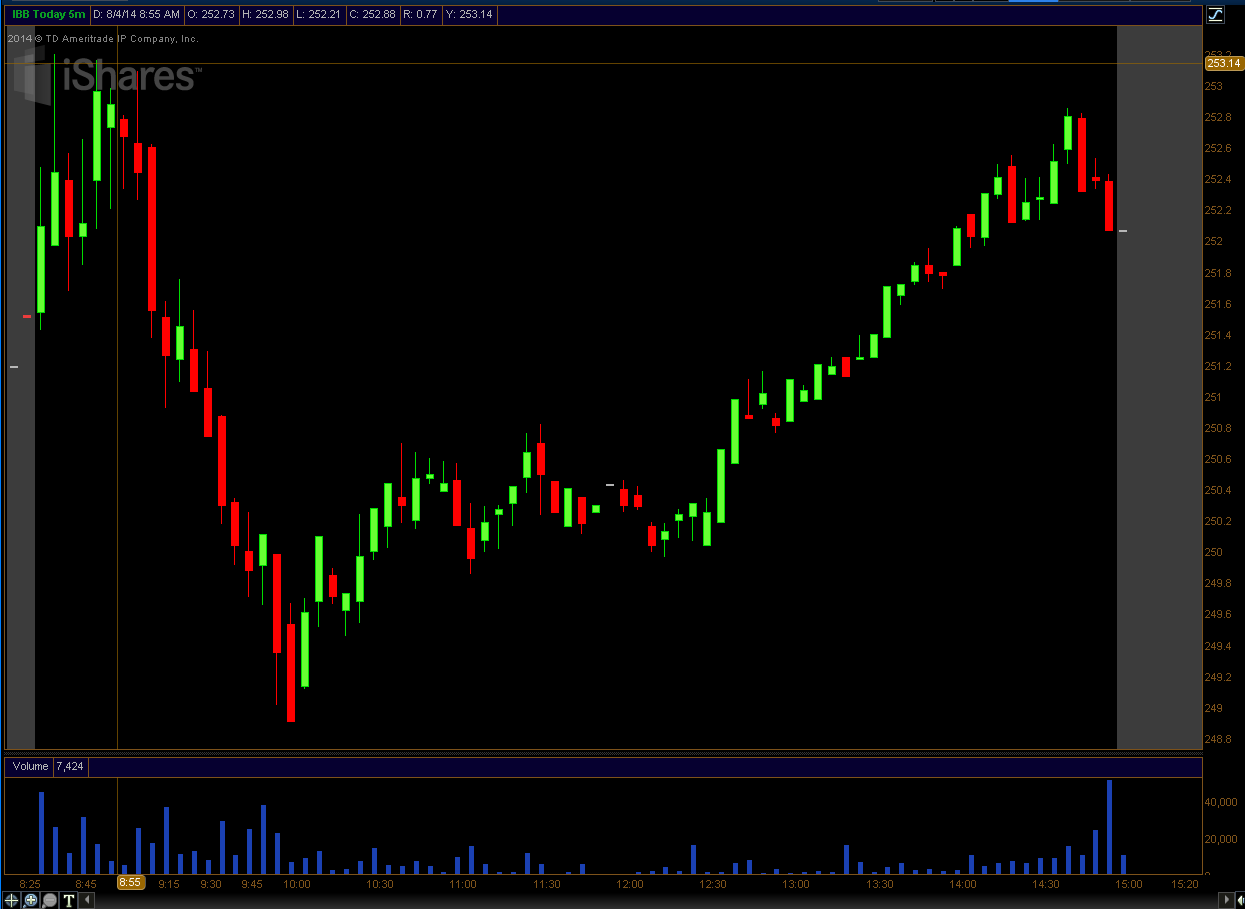
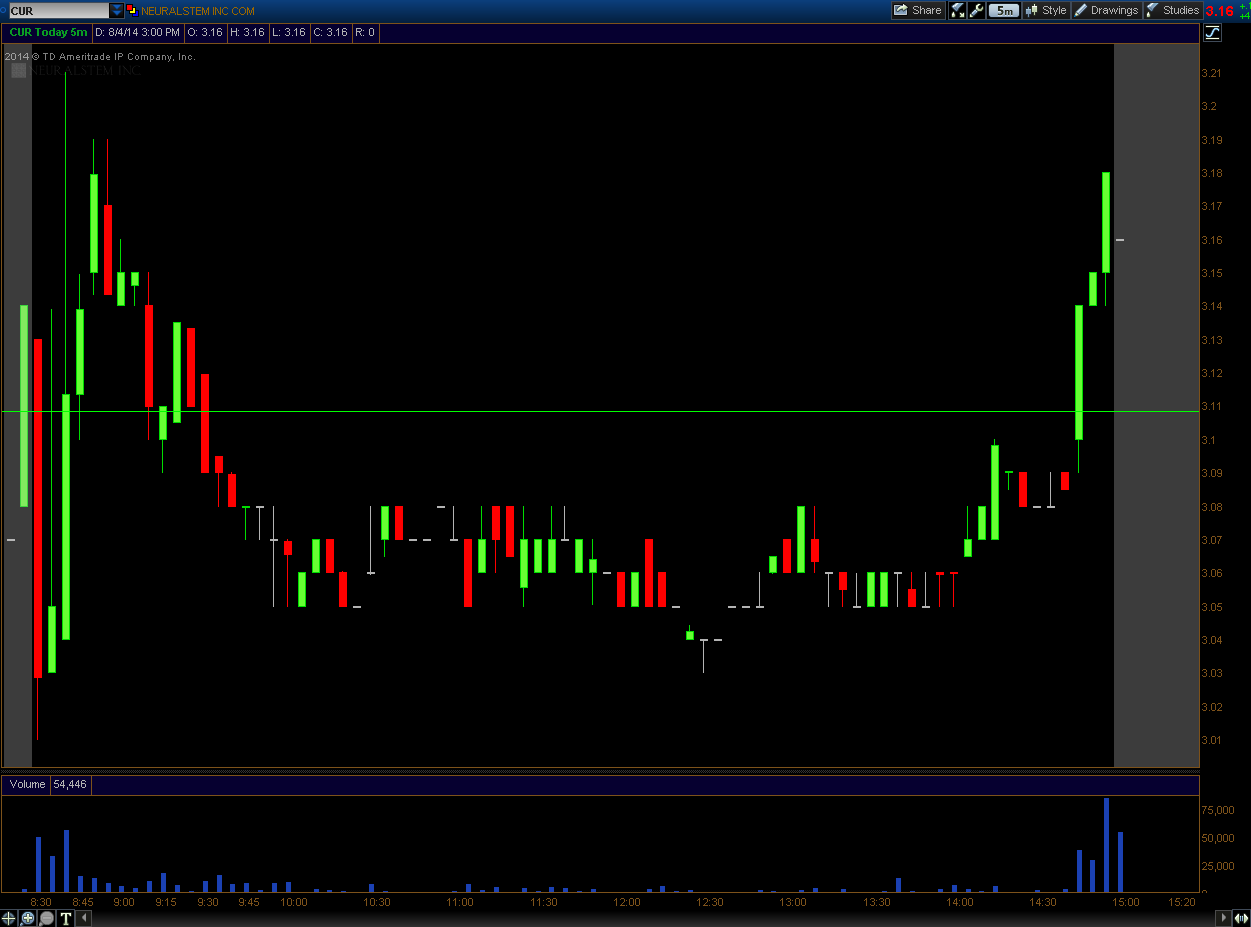
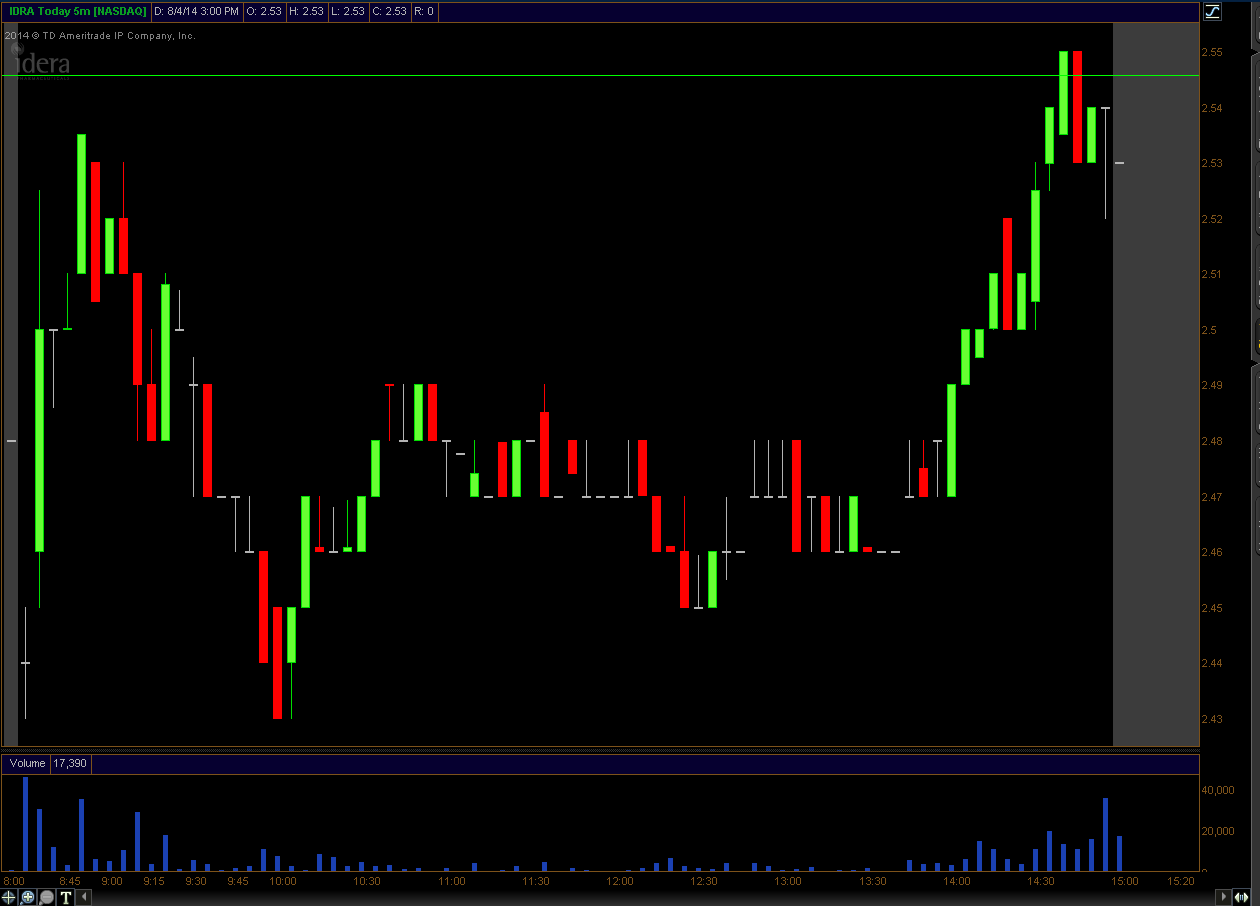
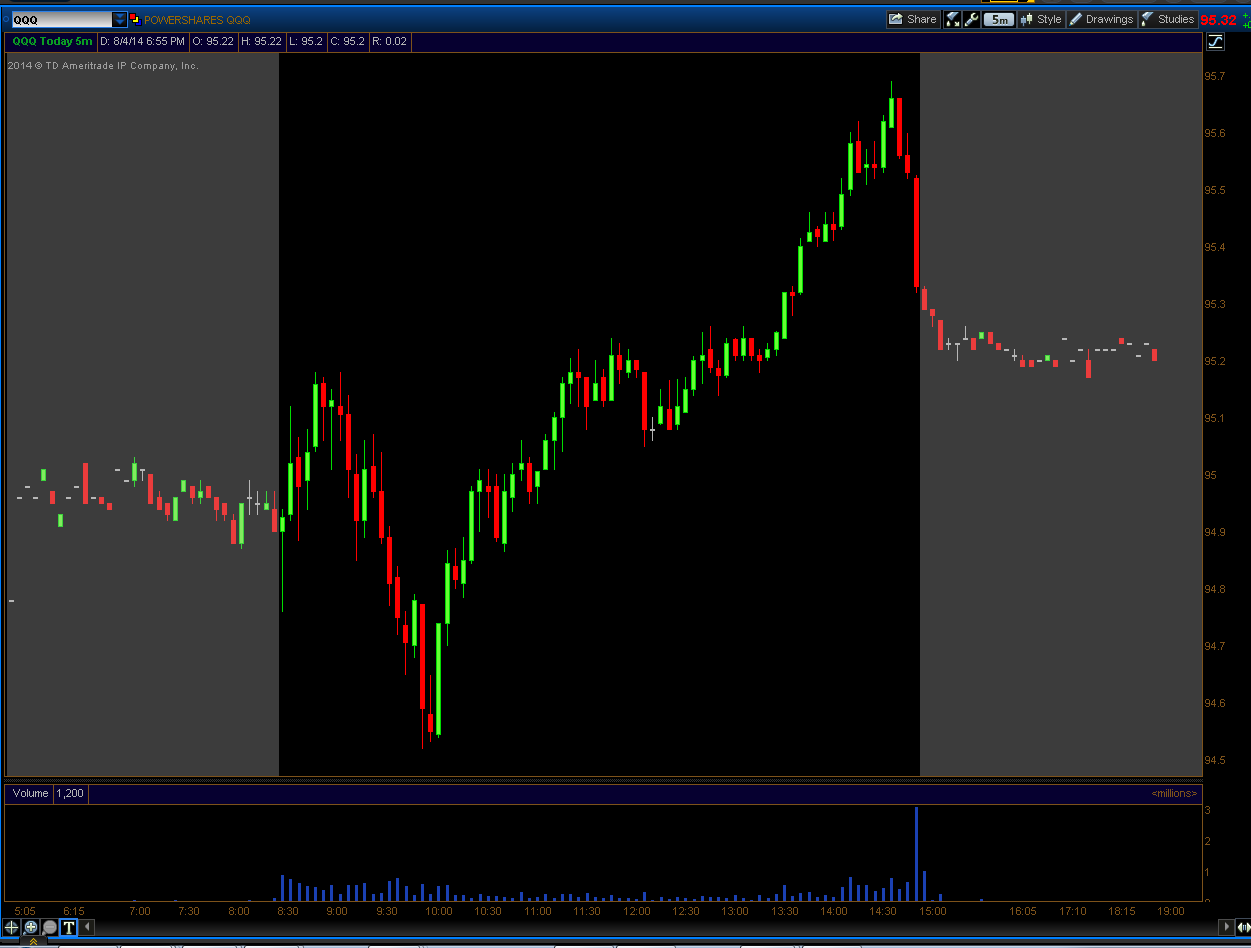
Today we see close harmony between the IBB and two of our biobabies, CUR and IDRA. Plus we see a relationship between the QQQ and the IBB. But the IBB doesn't track as closely, but there’s clearly influence.
Some days it’s the QQQ leading the way, some days the IBB is the leading indicator, and some days there is some divergence.
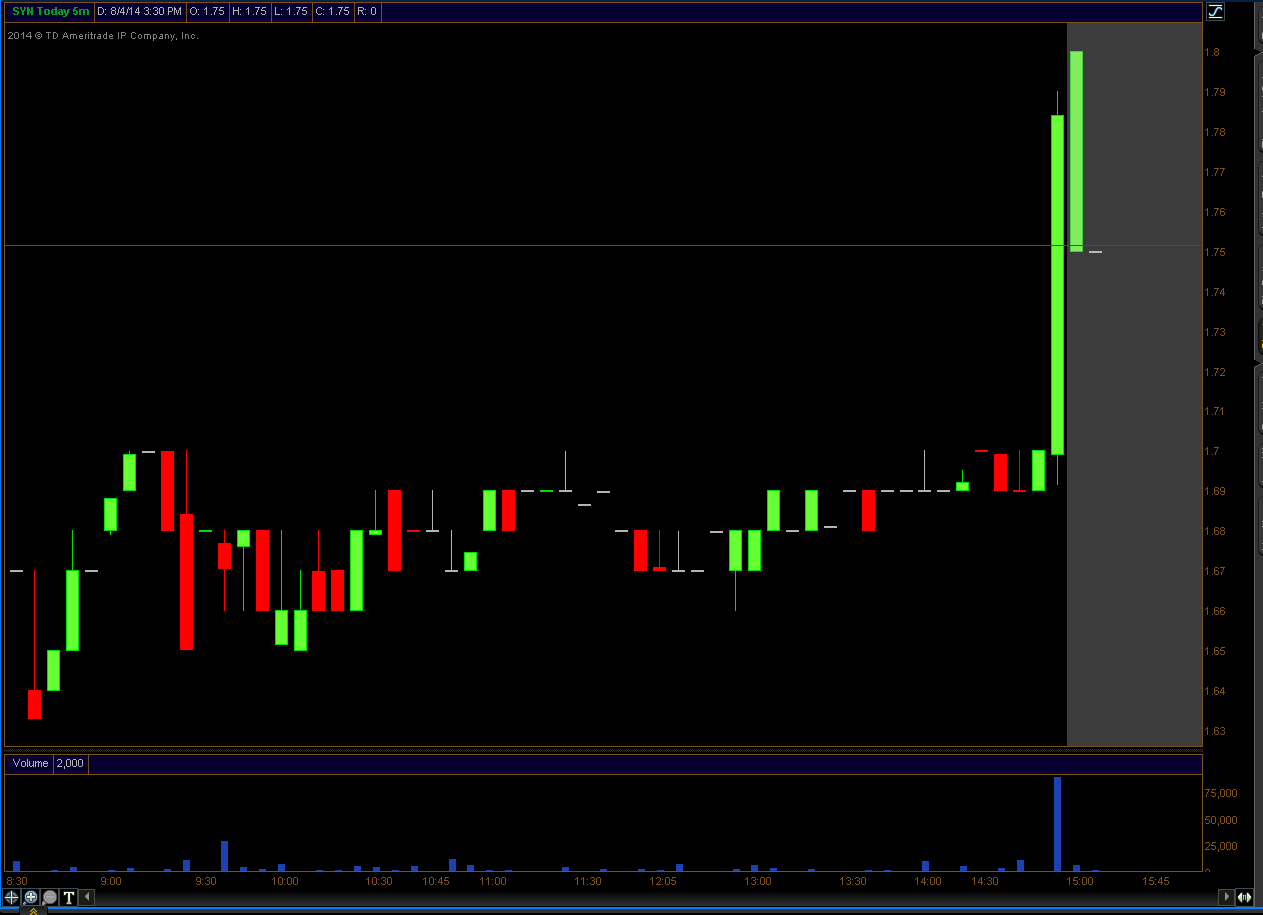
The very bottom chart is SYN, which we see today, like the others, had an early rise, pull-back and then rally… but, the rally was stronger at the close and looks closer to the QQQ.
(Scroll down for all 5 charts, click each chart to enlarge, grey areas are outside regular market hours. Cross posted to relevant boards)
IBB 5 minute
CUR 5 minute
IDRA 5 Minute
QQQ 5 minute
SYN 5 minute
Avant Technologies Equipping AI-Managed Data Center with High Performance Computing Systems • AVAI • May 10, 2024 8:00 AM
VAYK Discloses Strategic Conversation on Potential Acquisition of $4 Million Home Service Business • VAYK • May 9, 2024 9:00 AM
Bantec's Howco Awarded $4.19 Million Dollar U.S. Department of Defense Contract • BANT • May 8, 2024 10:00 AM
Element79 Gold Corp Successfully Closes Maverick Springs Option Agreement • ELEM • May 8, 2024 9:05 AM
Kona Gold Beverages, Inc. Achieves April Revenues Exceeding $586,000 • KGKG • May 8, 2024 8:30 AM
Epazz plans to spin off Galaxy Batteries Inc. • EPAZ • May 8, 2024 7:05 AM

