


Tuesday, July 29, 2014 11:37:40 AM
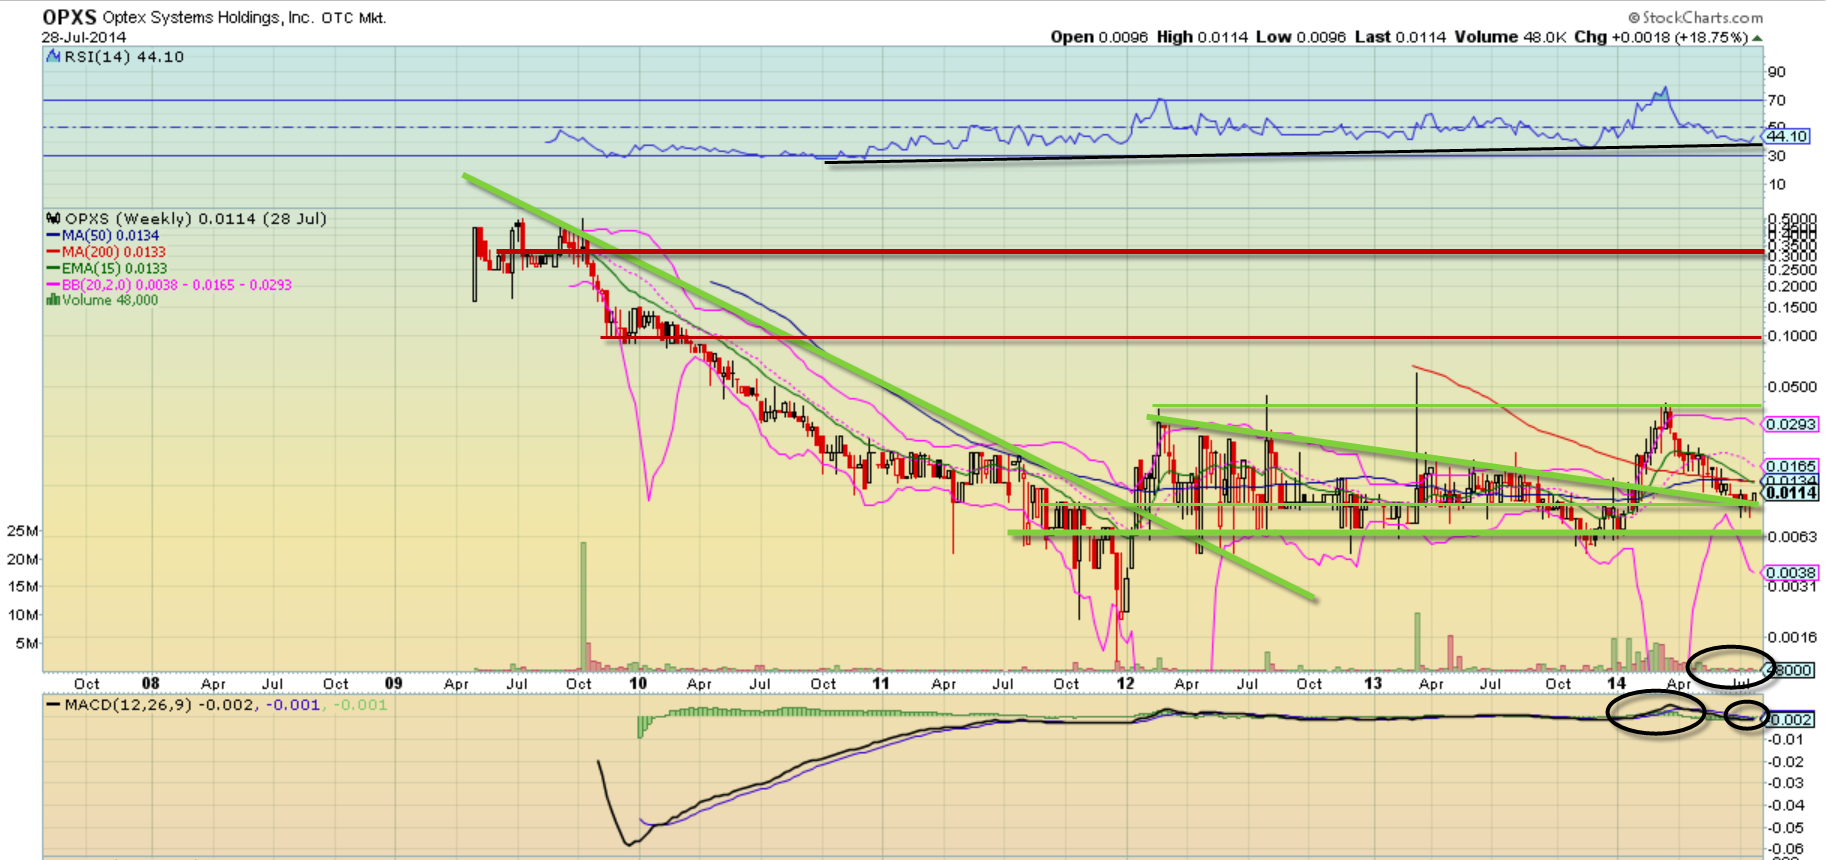
-First off note the major downtrend on the chart, represented with the trendline resistance I drew and ended back in January 2012. That was when the stock was at it's weakest and the bears were having it's way with it. Though the stock's price broke the trendline in early 2012, that doesn't mean BOOM instant uptrend appears. You've got to work off those downtrends and that often means lots and lots of consolidation/ sideways back and forth range-bound trading.
-When it comes to jockeying for position, lows and highs are how the bulls and bears keep score, so if the highs and/or lows are higher, advantage bulls. Other way around, advantage bears. I like to use the open and closing points on the candles when it comes to determining highs and lows (wicks mark extremes, not as significant, imo), especially on weekly charts. With that in mind check out the major lows on the chart starting with the one around Jan 2012. After nearly two years of consolidating in 2012 and 2013, it made a new swing low in late 2013, and if this current dip (we're seeing now) holds squarely above that 2013 low, then imo that's confirmation that OPXS is indeed working towards it's first actual uptrend on this time frame.
-The rally and breakout earlier this year did 2 very important things. First it broke the most recent trendline resistance which started in early 2012 and was much less steep than the first trendline marked. What it also did was mark a breakout (attempt) on this long term time frame with the weekly chart printing a new closing candle high, higher than any prior one during this consolidation pattern which started in late 2010.
-As you know, the breakout attempt was quickly smacked back down and now it's going on something like 4 months of pulling back, back inside of that old range and so far indicating a failed breakout attempt. However having an initial rejection and pullback on a breakout attempt doesn't mean the stock isn't just setting up in a more thorough manner for a breakout down the road, and imo there can be lots of clues as to how the stock pulls back as to what it has planned in the future.
-First, notice that the pullback is now testing the old trendline resistance for support, which is a chart concept basic; Old resistance becomes new (potential) support and vice versa. Second, notice the complete lack of volume during this entire pullback phase and even how little came near the last peak. Look at the volume which came earlier this year right before and as the stock was breaking that trendline and out of that descending triangle pattern.. it may have been assisted with a chart group promotion (who timed it well at that key inflection point) but any flippers along the way I believe got soaked up by people who wanted to accumulate, and yes there are some of us here who bought during this period. The lack of volume near the top and on the pullback is for me a clear indication that there was a significant amount of patient holders buying, who didn't sell at that peak and have not been spooked out despite this 4 month pullback. You may not see it but in my eyes, it's as plain as the sun. I'm talking shares in the millions, and we haven't seen anything other than piddly sized blocks for months and months.
-The MACD on the weekly here is also setting up and indicating positive momentum and overall bullish strength. The ideal thing to look for on plays like this would be the MACD lines getting back to the 0 range, consolidating around 0 and after a long enough base, breaking out above 0 and into positive territory. As you can see that's exactly what has been setting up here, and after the pullback the MACD lines have come to test the 0 range (old resistance, new support) for support and the short term (black) line will hopefully soon cross back above the long term (purple) line, indicating the bulls have the momentum back in their favor.
-There you have it. Right or wrong, this is what I see and why I'm putting my money where my mouth is. I think this chart has .10+ written all over it, but fact of the matter is maybe the stock doesn't hold support here and gets stuck under .006 with massive volume holding it down.. What I see as strong subtle bullish signs may one day prove to be a losing battle, so who knows.
However I love what I see here and it's such a nice and rare example of what I look for, and that's why Shell's DD is holding extra weight with myself. After all, we are essentially arriving at the same conclusion via 2 completely different paths, that shares are locked up and this is a ticking time bomb waiting to splode. To put it another way, if I indeed was right and there was as much hidden strength to this stock as I claim, then there would in theory be a fundamental reason behind it, so Shell is giving me exactly what I'd hope to hear and see. We both may be wrong but imo at worst we are just way off on timing, but in the mean time while the stock continues to do what it's doing, it's actually resulting in a larger and larger consolidation base, which ultimately is better for the stock and it's potential ensuing breakout.
Recent OPXS News
- Form 4 - Statement of changes in beneficial ownership of securities • Edgar (US Regulatory) • 05/22/2024 08:23:08 PM
- Form 4 - Statement of changes in beneficial ownership of securities • Edgar (US Regulatory) • 05/22/2024 08:15:05 PM
- Form 8-K - Current report • Edgar (US Regulatory) • 02/22/2024 08:46:32 PM
- LifeVantage Appoints Dayton Judd to the Board of Directors • GlobeNewswire Inc. • 02/15/2024 09:05:00 PM
- Form 8-K - Current report • Edgar (US Regulatory) • 01/24/2024 02:30:11 PM
- Form DEF 14A - Other definitive proxy statements • Edgar (US Regulatory) • 01/22/2024 09:05:20 PM
- Form 4 - Statement of changes in beneficial ownership of securities • Edgar (US Regulatory) • 01/10/2024 09:30:26 PM
- Form 4 - Statement of changes in beneficial ownership of securities • Edgar (US Regulatory) • 01/10/2024 09:22:07 PM
- Form 8-K - Current report • Edgar (US Regulatory) • 01/05/2024 11:04:26 AM
FEATURED BNCM and DELEX Healthcare Group Announce Strategic Merger to Drive Expansion and Growth • Jul 2, 2024 7:19 AM
EWRC's 21 Moves Gaming Studios Moves to SONY Pictures Studios and Green Lights Development of a Third Upcoming Game • EWRC • Jul 2, 2024 8:00 AM
NUBURU Announces Upcoming TV Interview Featuring CEO Brian Knaley on Fox Business, Bloomberg TV, and Newsmax TV as Sponsored Programming • BURU • Jul 1, 2024 1:57 PM
Mass Megawatts Announces $220,500 Debt Cancellation Agreement to Improve Financing and Sales of a New Product to be Announced on July 11 • MMMW • Jun 28, 2024 7:30 AM
VAYK Exited Caribbean Investments for $320,000 Profit • VAYK • Jun 27, 2024 9:00 AM
North Bay Resources Announces Successful Flotation Cell Test at Bishop Gold Mill, Inyo County, California • NBRI • Jun 27, 2024 9:00 AM

