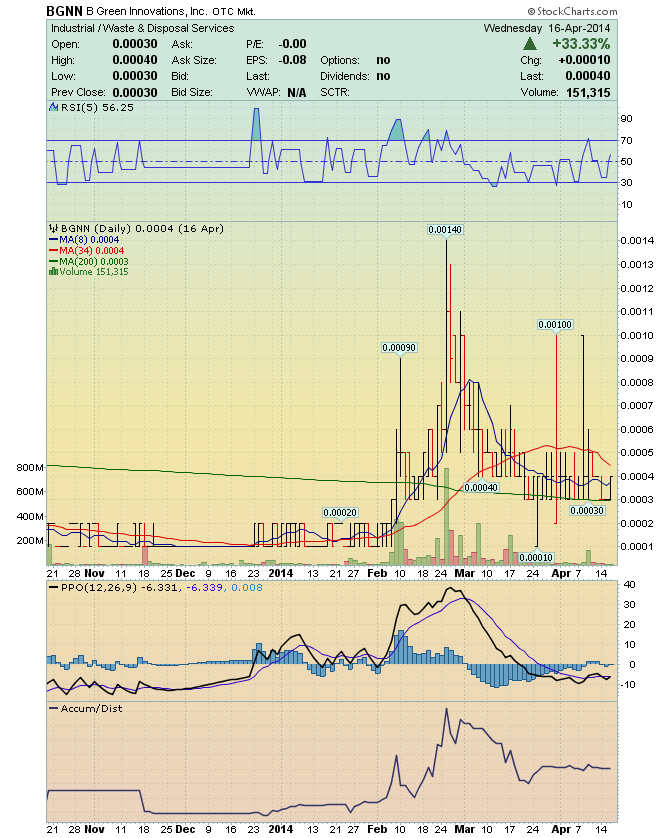
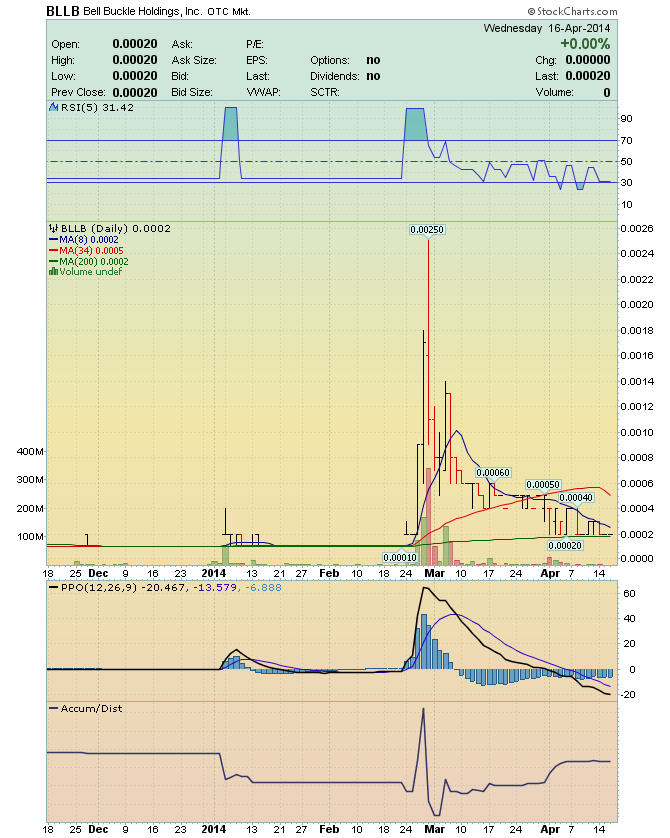
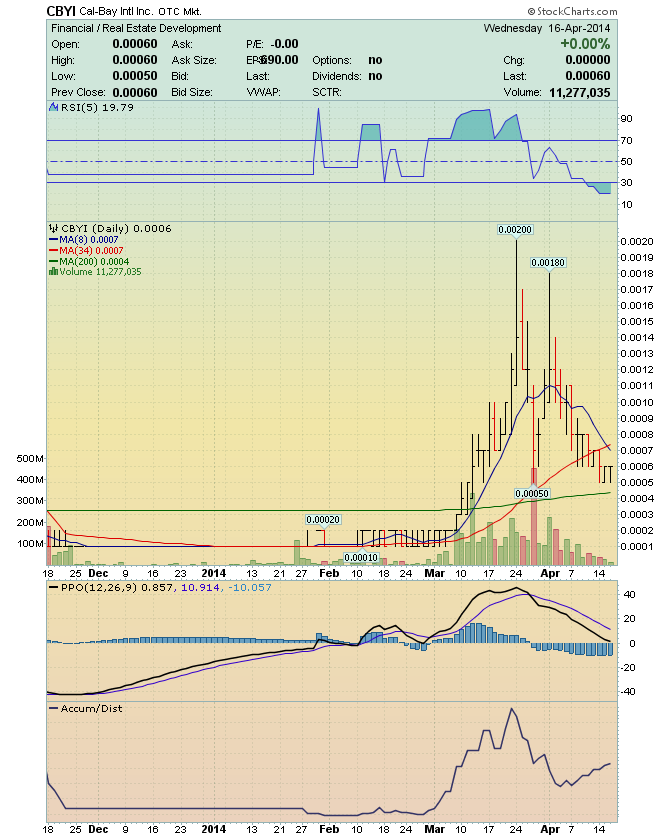
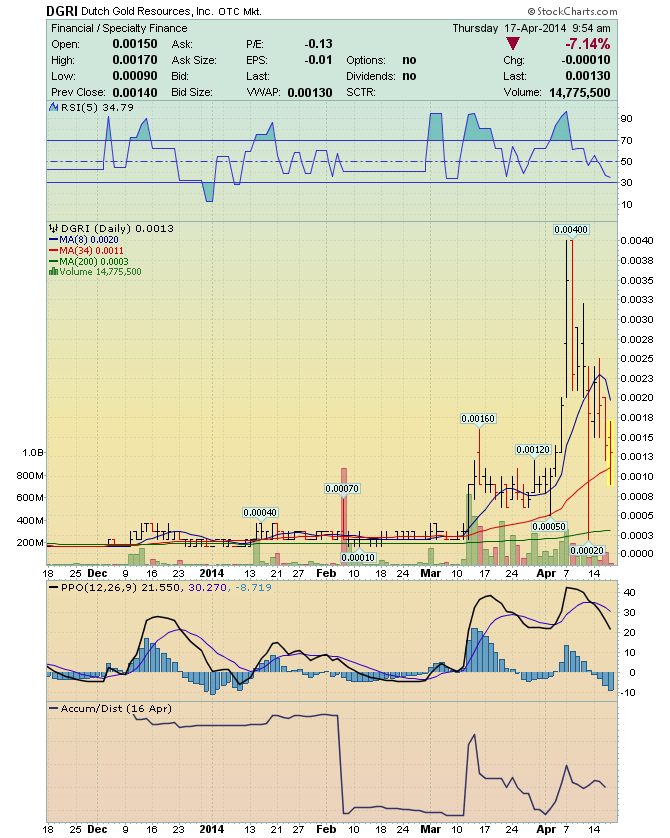
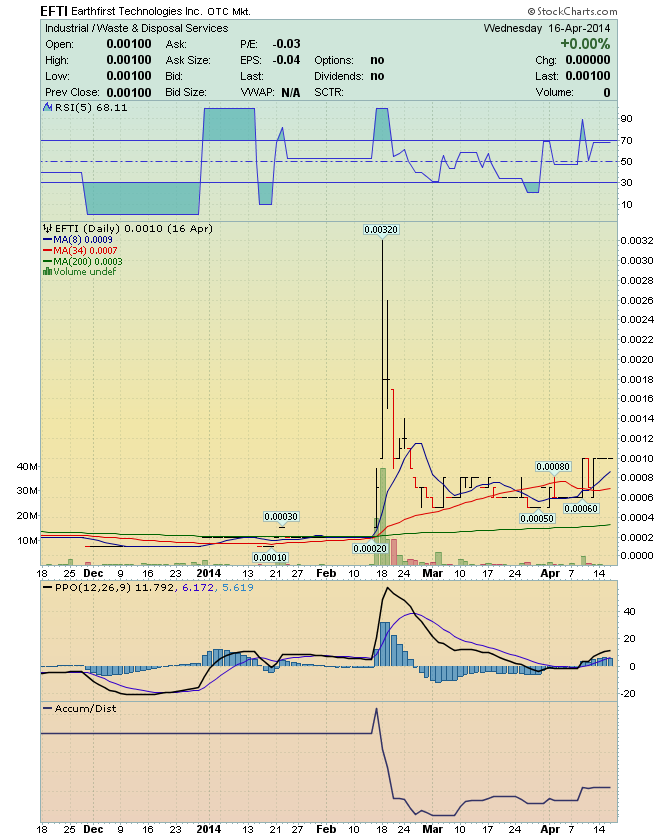
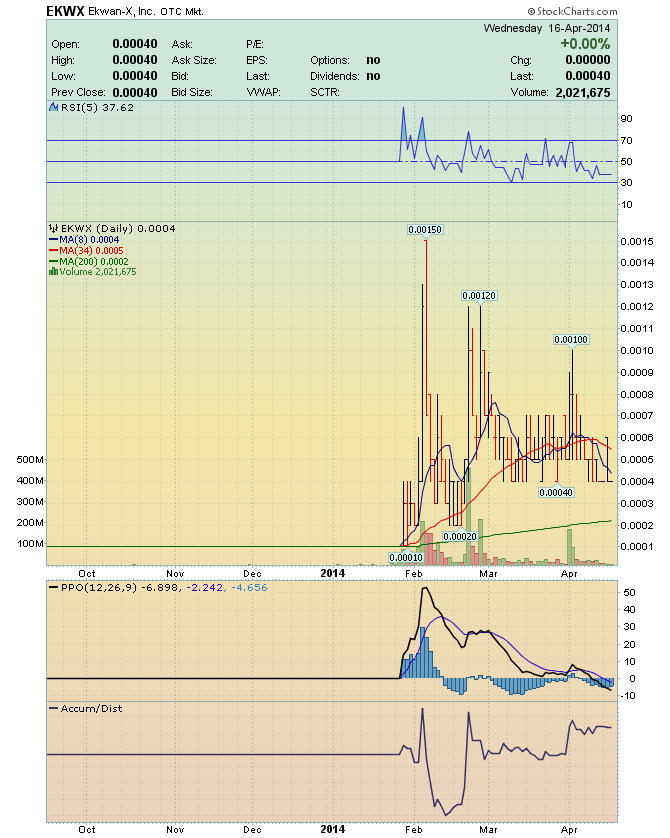
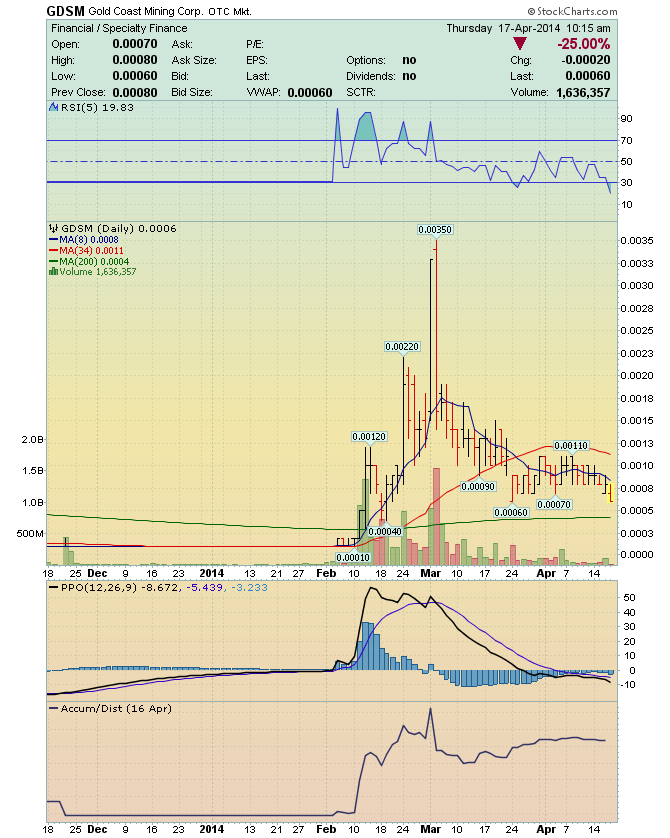
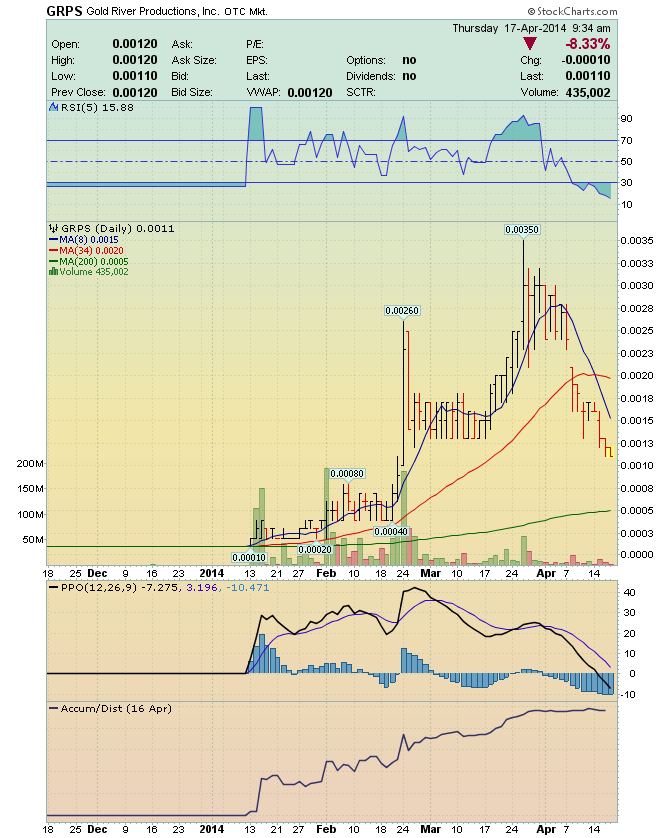
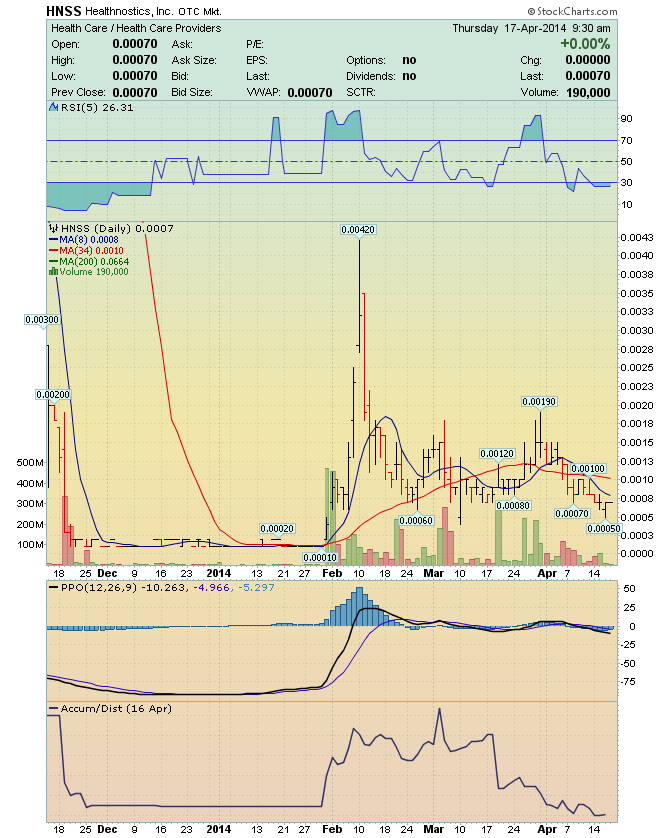
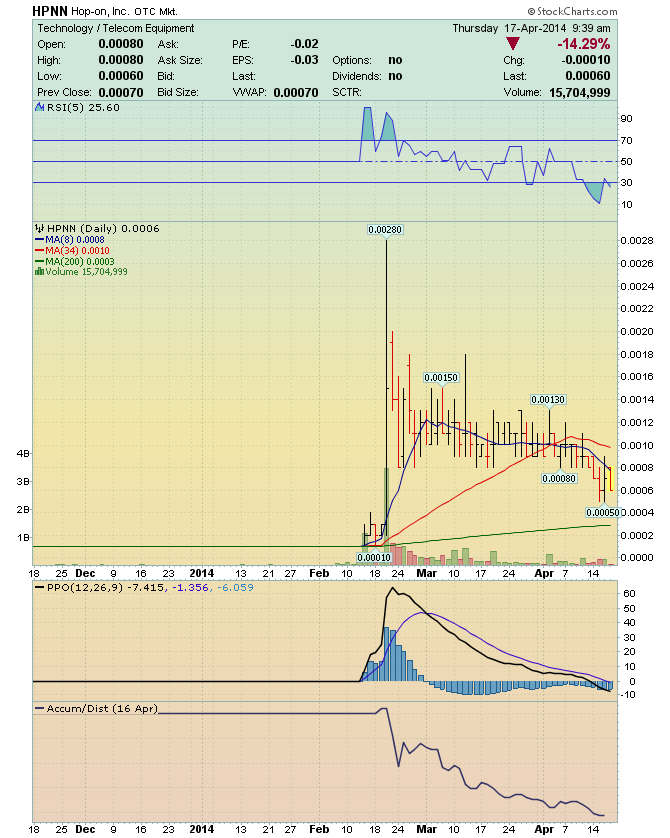
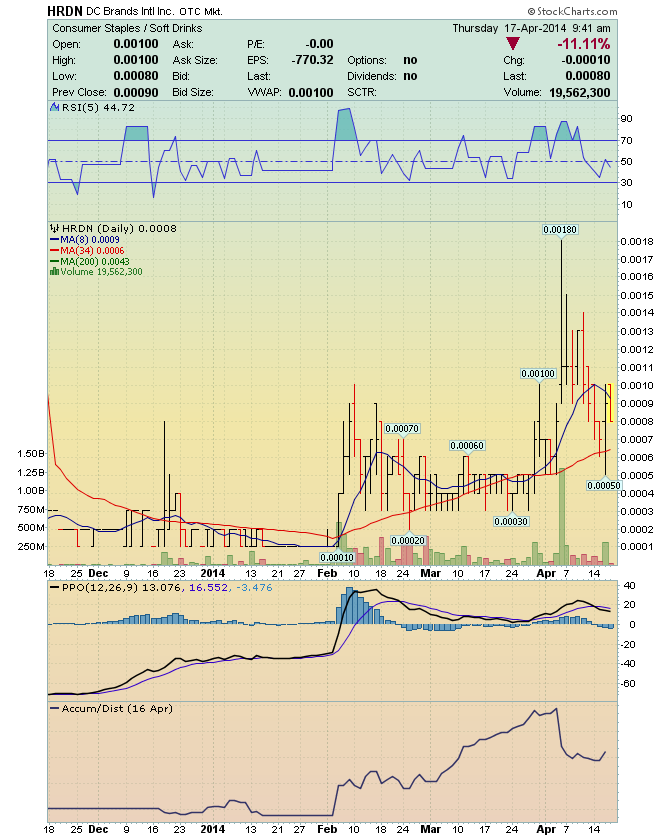
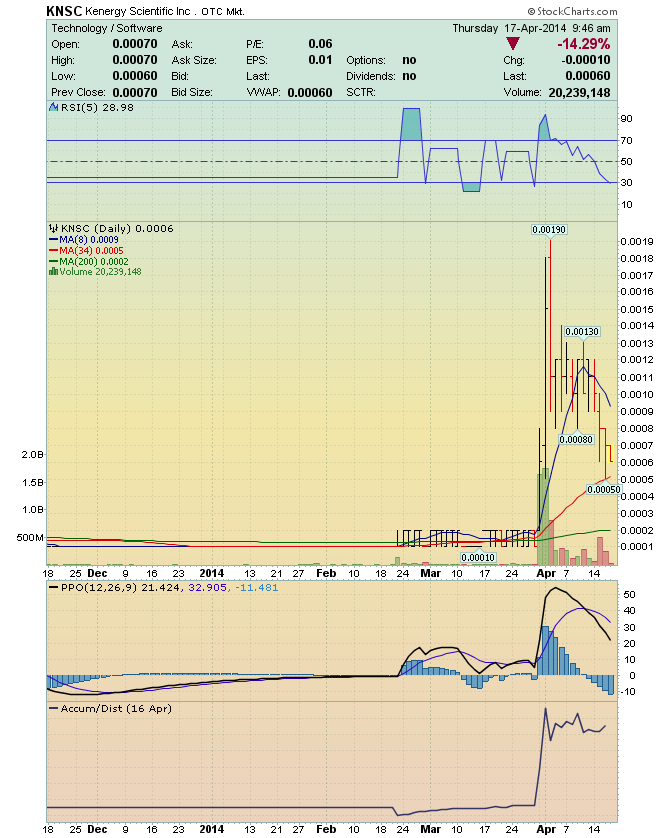
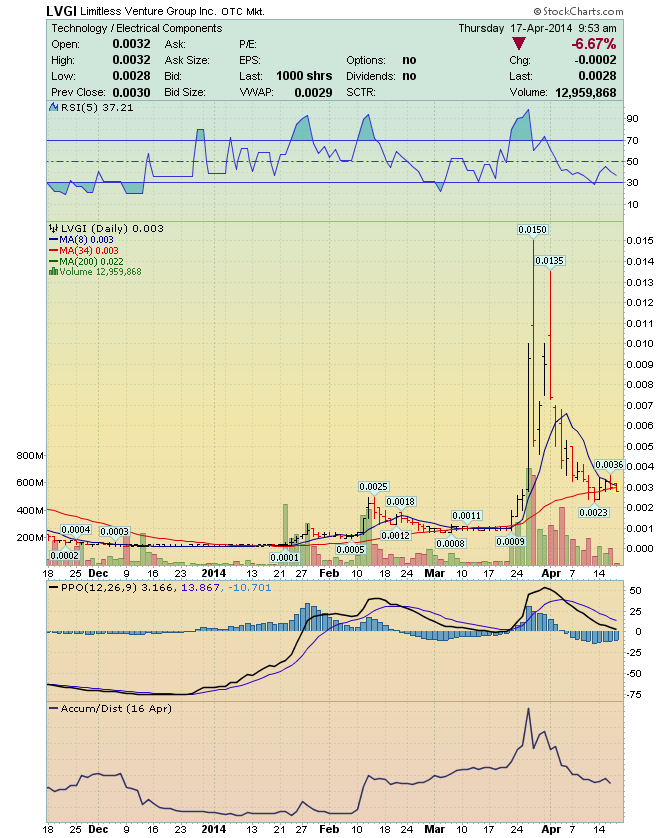
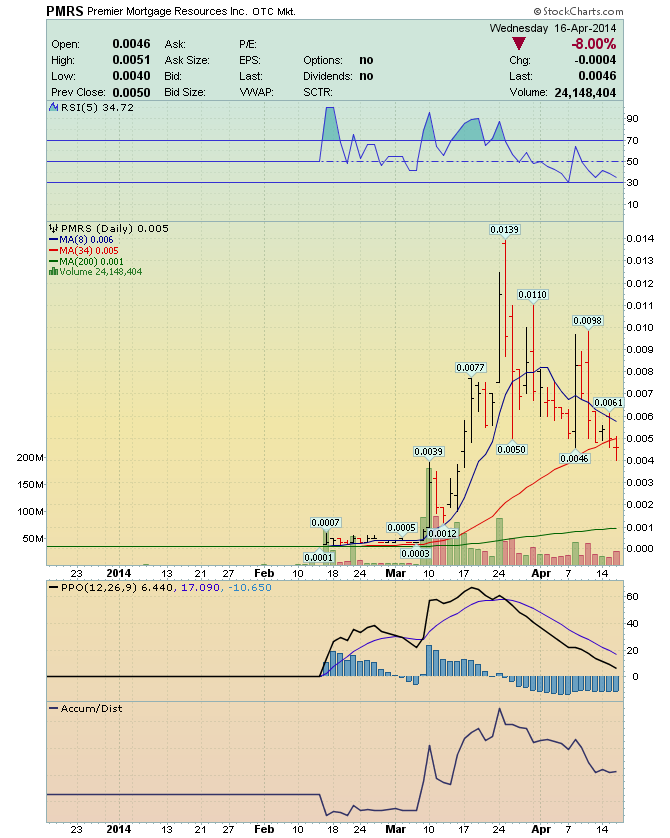
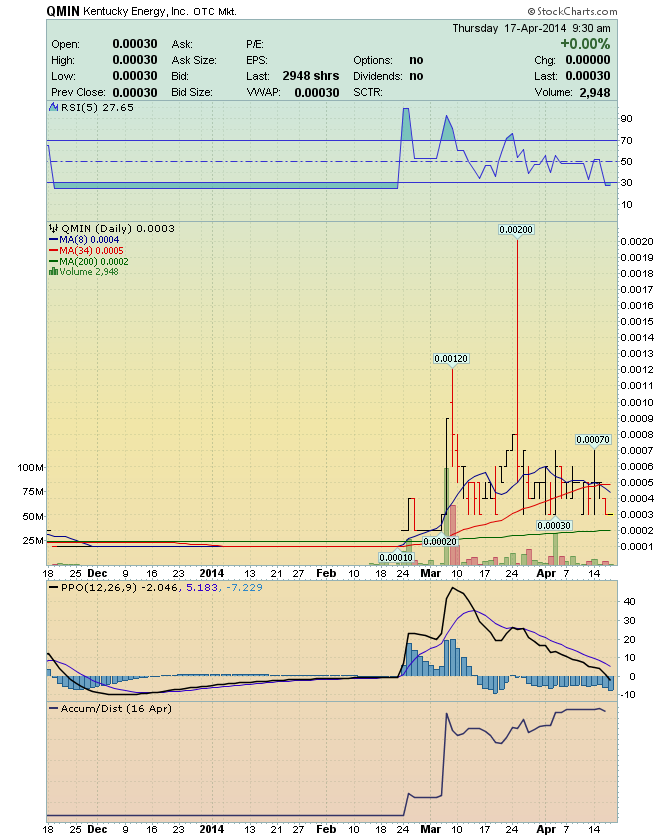
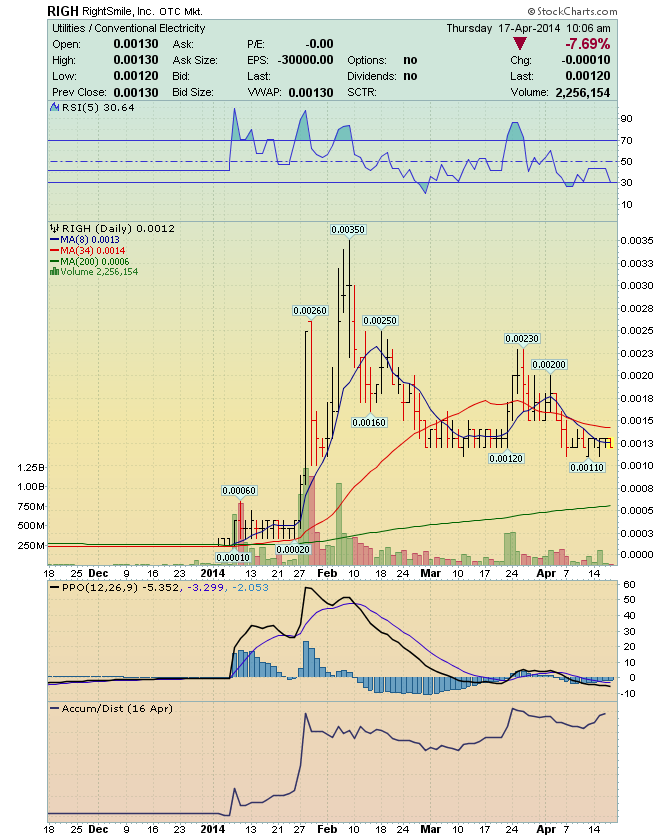
Trader53's Multi-BAGGERS from 0.0001 Good Morning, Traders ! The following is a list of stocks, that climbed from Bid 0.00 - Ask 0.0001 Library of Embedded Charts (for study of chart pattern similarity and potential Targets) The Bid 0.00 through Bid 0.0001 - Ask 0.0002 stock http://investorshub.advfn.com/boards/read_msg.aspx?message_id=100080833 Trader 53's - Investment Philosophy http://investorshub.advfn.com/boards/read_msg.aspx?message_id=90526488 This Board uses Elliott Wave Theory to calculate its Price Targets http://investorshub.advfn.com/boards/read_msg.aspx?message_id=99306108 http://www.acrotec.com/elliottwave/ew2.jpg http://www.pennystocknation.com/images/tripzero/tripzeroplchart.gif images.investorshub.advfn.com/images/uploads/2014/4/17/gtjjtAPRU_Chart_1_from_0.0001_to_0.006.png images.investorshub.advfn.com/images/uploads/2014/4/17/fbdflAVOP_Chart_9_from_0.0001_to_0.0023.png images.investorshub.advfn.com/images/uploads/2014/4/18/qpkwlBGNN_Chart_2_from_0.0001_to_0.0014.png images.investorshub.advfn.com/images/uploads/2014/4/17/pfkrmBLLB_Chart_2_from_0.0001_to_0.0025.png images.investorshub.advfn.com/images/uploads/2014/4/17/wpyceCBYI_Chart_13_from_0.0001_to_0.002.png images.investorshub.advfn.com/images/uploads/2014/4/17/zimroCWIR_Chart_4_from_0.0001_to_0.007.png images.investorshub.advfn.com/images/uploads/2014/4/18/bcqosDGRI_Chart_8_from_0.0001_to_0.004.png images.investorshub.advfn.com/images/uploads/2014/4/18/yeztcEFTI_Chart_3_from_0.0001_to_0.0032.png images.investorshub.advfn.com/images/uploads/2014/4/17/glyqlEKWX_Chart_2_from_0.0001_to_0.0015.png images.investorshub.advfn.com/images/uploads/2014/4/17/cjzmuEMLL_Chart_2_from_0.0001_to_0.001.png images.investorshub.advfn.com/images/uploads/2014/4/18/vfvwjGDSM_Chart_10_from_0.0001_to_0.0035.png images.investorshub.advfn.com/images/uploads/2014/4/18/lkkjlGRPS_Chart_3_from_0.0001_to_0.0035.png images.investorshub.advfn.com/images/uploads/2014/4/18/tadf[HNSS_Chart_7_from_0.0001_to_0.0042.png images.investorshub.advfn.com/images/uploads/2014/4/18/swnyeHPNN_Chart_2_from_0.0001_to_0.0028.png images.investorshub.advfn.com/images/uploads/2014/4/18/rigdoHRDN_Chart_4_from_0.0001_to_0.0018.png images.investorshub.advfn.com/images/uploads/2014/4/18/ddtkjKNSC_Chart_10_from_0.0001_to_0.0019.png images.investorshub.advfn.com/images/uploads/2014/4/18/vgkcpLVGI_Chart_6_from_0.0001_to_0.015.png images.investorshub.advfn.com/images/uploads/2014/4/18/fgc[iMONA_Chart_2_from_0.0001_to_0.0044.png images.investorshub.advfn.com/images/uploads/2014/4/17/bjyjzPMRS_Chart_6_from_0.0001_to_0.0139.png images.investorshub.advfn.com/images/uploads/2014/4/18/lisjiQASP_Chart_8_from_0.0001_to_0.0038.png images.investorshub.advfn.com/images/uploads/2014/4/18/iofblQMIN_Chart_1_from_0.0001_to_0.002.png images.investorshub.advfn.com/images/uploads/2014/4/18/hxwacRIGH_Chart_2_from_0.0001_to_0.0035.png images.investorshub.advfn.com/images/uploads/2014/4/18/ryeqlRNWF_Chart_3_from_0.0001_to_0.0025.png images.investorshub.advfn.com/images/uploads/2014/4/17/dvtwhSMVI_Chart_3_from_0.0001_to_0.0027.png images.investorshub.advfn.com/images/uploads/2014/4/18/tqzogTEMN_Chart_4_from_0.0001_to_0.0099.png images.investorshub.advfn.com/images/uploads/2014/4/18/urvayTTDZ_Chart_5_from_0.0001_to_0.049.png images.investorshub.advfn.com/images/uploads/2014/4/18/hgxzdUMNG_Chart_2_from_0.0001_to_0.0037.png images.investorshub.advfn.com/images/uploads/2014/4/18/su[gwUTRM_Chart_9_from_0.0001_to_0.0146.png images.investorshub.advfn.com/images/uploads/2014/4/18/qfuatWTWO_Chart_4_from_0.0001_to_0.0029.png
 News
News  Market Data
  Discover