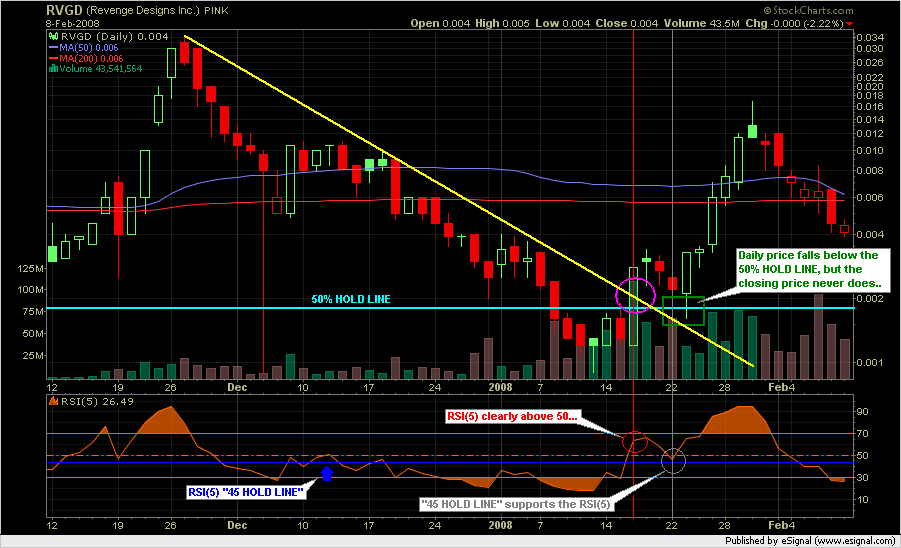
** Quick Chart Lesson: Trendline Break + 50% HOLD LINE **
#1 Green Flag: Price closes ABOVE a key trendline... on chart below, the yellow line shows a key trendline, and the pink circle shows the break of the trendline...
#2 Green Flag: Where is RSI(5)? Make sure RSI(5) is above 50 (red vertical line represents where RSI(5) is on the day of the break).
#3 Green Flag: Does 50% of the big white candle "hold" (blue horizontal line)? As long as the closing price remains above the 50% HOLD LINE, then market psychology towards the stock remains bullish...
#3A Green Flag: Does RSI(5) remain above 45** whenever the 50% line is 'tested'? As can be seen, the 3rd day after the trendline break (denoted by gray vertical line), the price made a big move on the 50% HOLD LINE; however, the RSI(5) held strong above 45... next day, the explosion began...
** I use 45 as an safety policy towards 'head fakes'... sometimes the RSI(5) will drop slightly below 50, and then the next day skyrockets back above 50. By using 45, I give it an extra cushion to better my probabilities of not getting 'head-faked'...
These types of set-ups can be known as "ATM Machines"... buy at the 50% line, sell w/in the next few days and then buy back again at the 50% level (remember, ask yourself: "Is RSI(5) holding 45?" before you buy back in)...
Register for free to join our community of investors and share your ideas. You will also get access to streaming quotes, interactive charts, trades, portfolio, live options flow and more tools.


 News
News  Market Data
  Discover