** Chart "Quick" Lesson: 'Areas' to take Profit **
Oink oink... don't get greedy! This is very much so easier said then done. You enter a trade, it's going great and you feel on top of the world... this aspect of trader psychology is one of the hardest to 'overcome'.
Technical analysis (TA) is a GREAT tool for emotion busting... if you let your emotions run the show, you will never survive. TA allows you to leave your emotions at home, and play the game disciplined.
Exiting trades is one of the most essential parts of the game. This lesson will cover "areas" that should be your target to sell at for profit.
1) Previous Points of Resistance
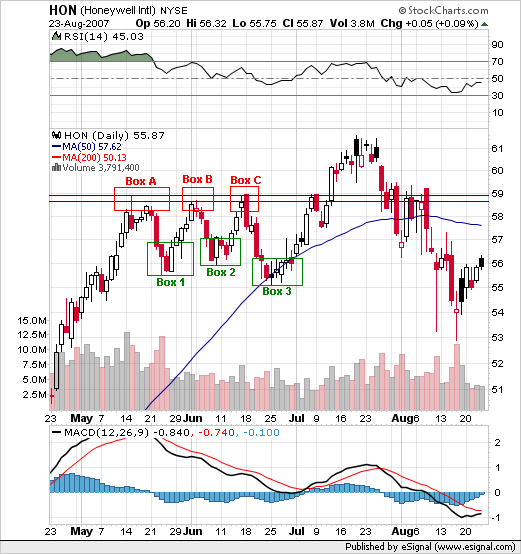
Knowing where previous points of resistance are can save you lots of hassle. If the past history shows that the PPS struggles to get past a certain location, it NEEDS to be a spot where some profit taking occurs. Notice in the HON chart below... knowing where previous resistance was would have eliminated the greed, and allowed for some profitable trades.
Let's say you buy shares of HON within Box 1 area. You should immediately find the previous resistance, and set that as the area you will be taking at least some profit. As can be seen on the chart, this area is Box A. Notice how the price headed back up to that area, and then bounced off... if you only listened to what TA was telling you, you would have made a great trade!
If you buy shares within Box 2, you now have TWO previous points of resistance that give you a great idea of where you should begin to take some profits. Now, Boxes A and B become valuable points on the chart... once again, price heads back up, and BOOOOM... bounces off again... if you listened to your TA, you would have made another great trade...
SAME THING again if you bought shares in Box 3. Except you now have THREE areas yelling, "take some profit in this area!!"...
2) Moving Averages
Another "area" to look to take some profits is when the PPS is approaching key moving averages. Moving averages are another form of Resistance, which makes them very important.
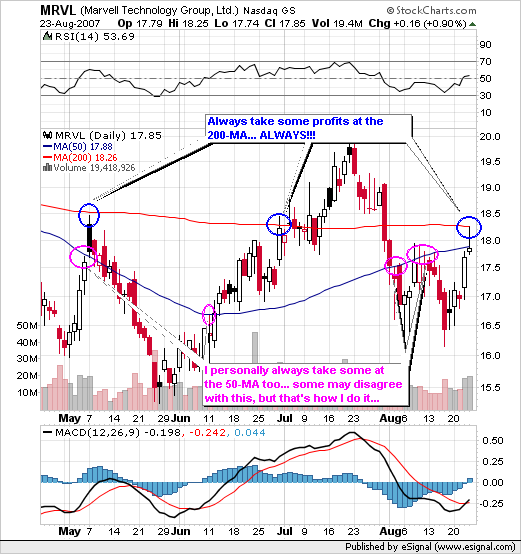
In the MRVL chart, I have plotted two of the key moving averages I use... the 50 and 200 day moving averages. Notice how the PPS often bounced off the 50-MA for a few days then moved up to the 200-MA before finally falling. This is why I always take some profit at the 50-MA. If it declines just a tad then goes up, I STILL have some shares... if it continues to retrace, I just get rid of the rest... either way, I still have made a profit (and that's the name of the game). Same goes for the 200-MA... as you can see on the MRVL chart, the 200-MA is typically much tougher to break through.
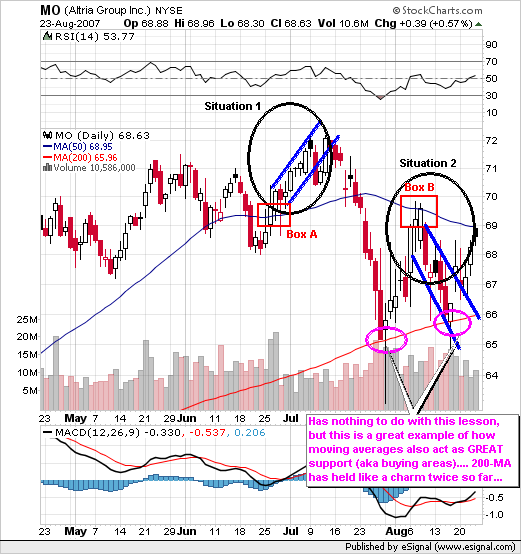
The MO chart below is a great example of why taking some profits at these moving averages is always smart.
Situation 1: You take some profit at Box A... price continues to go up... good thing you held on to "some" of your shares :) $$$
Situation 2: You take some profits at Box B... price keeps falling on you... you still do have shares, so you don't make as much as you could have if you would have sold them all at Box B, but nonetheless, you still have made a profit.
My point... as long as you take profit at these moving averages, you "keep yourself in the game" while locking in profits. Sure one situation is better than the other, but both ensure you HAVE PROFITS!!!
Questions? Requests for another chart lesson? Let me know!
Register for free to join our community of investors and share your ideas. You will also get access to streaming quotes, interactive charts, trades, portfolio, live options flow and more tools.


 News
News  Market Data
  Discover