 News
News  Market Data
  Discover
Support: 888-992-3836
Copyright © 2023 InvestorsHub Inc.


Register for free to join our community of investors and share your ideas. You will also get access to streaming quotes, interactive charts, trades, portfolio, live options flow and more tools.
Nice picks with AFYG and WDRP. Too bad I was not in them but good pickups! Thanks for showing your 60 min strategy. I think its a good element to add to my pinchers that I was not using before.
EDWY On My Radar!!!, EXBX Looks Real Good Right
Now.IMO!
Woah! EXBX super tight on the daily - snuck up on me!
http://stockcharts.com/h-sc/ui?s=EXBX&p=D&yr=0&mn=3&dy=20&id=p84827845978
AFYG looking great on the 60 min - still opening up!
I know you meant TGGI, Yea, I'm loaded up there
and getting more when I see a more confident
bottom.
I know, I'm just goofing off  Heaven knows I'm trying to be patient with the other pinchers right now...HLXW, ARYX, PGGI, NVLT.
PATIENCE does a trader GOOD!!!!! It
will happen!!
I hope so. First steps, get off the .06 x .09 and avoid those "0" volume days
IMO, FVSTA is Slowly making its way back to
.15-.17
Very true! Thanks as always ST! EM
FVSTA was a nice pinch...but...I haven't been able to sell for three days. Nothing happens there. Sure, it feels good to see your stock value jump up, but what's the point if you can't sell when you want to? hehe
How is FVSTA doing "Pincher-wise? TIA! EM
AFYG pinch now splitting out on the 60 min chart. ask super thin.
http://stockcharts.com/h-sc/ui?s=AFYG&p=60&yr=0&mn=0&dy=20&id=p86031558334
Lookls like UBS isn'tb ready to let ARYX fly just yet,,,lol
I just post a link to the chart. Like this:
http://stockcharts.com/h-sc/ui?s=ARYX&p=D&yr=0&mn=3&dy=0&id=p54107043428
If you have a picture of the chart (screen shot) and you write stuff on it, or whatever, then save it as a jpg and put it online somewhere then you can embed it into your post. You simply put the link to your image file, then highlight it and click the "image" button on the left of the iHub message box you're writing in. Like this:

I would like to post charts here. Is there a certain proceedure??
If not, can a board moderator or anyone else point me in the right direction.
tia
OK, ARYX, your gap is filled. Shall we try that again? Please?
I saw your pinch, i dont believe you had the adx on there before. but i knew it was pinchin. my previous post was somewhat tongue and cheek. dont take me too seriously. BTW i always compare the the daily with 60 min.
Looks like ARYX is breaking the pinch today. PPO crossing. Yippee!
Should see some volume pour in as alerts hit the high-tech traders. hehe.
http://stockcharts.com/h-sc/ui?s=ARYX&p=D&yr=0&mn=3&dy=0&id=p95783301803
PDGE 20M O/S and 30M A/S
I was a bit leery of PDGE yesterday when it bounced. It seems we've seen a couple fake breakouts lately. I mean, sure, it's nice to make money on those too, but I'm always worried of a sudden drop. Think HLXW or TGGI where it jumps up a big percentage, then drops right back down because the chart wasn't ready. Looking at PDGE, it seems the MACD and PPO have a long way to go before the "big bang". Maybe the hype can force this thing out of the pinch. I'll keep watching and jump in if it doesn't come crashing back down after this morning's action.
http://stockcharts.com/h-sc/ui?s=PDGE&p=D&yr=0&mn=3&dy=0&id=p37026663695
Maybe I should plan for an early breakout attempt on these tight pinchers? Plan to buy in early, sell the breakout attempt, then buy again for the later breakout?
Thanks Cytis! I've never looked on a 60-min chart for a pincher before. But obviously, it works. hehe
Thanks for your comments
ARYX looking like it wants to gap this morning.
By the way,,,How the heck do you post charts here,,,LOL ??
I don't mind if you post the 60 minute pinchers. But it would be appreciated if you could post the annotated charts with them. I like the different approach and its still a pincher in my opinion, just a shorter time frame pincher. Thanks for posting the charts to clarify it too, because I was also confused when you posted those tickers and I looked them up using the daily chart :)
In AFYG yesterday morning. I know I JUST posted that I wouldnt try to discuss 60min pinchers anymore - I am going to try and post this IMAGE of the chart setup. It looks like its going to open on the 60min chart so I am not sure how long the daily chart will hold up- anyway - I think its still a great entry for a quick return to the 60's at least-
again - this has some paint brush notes I quickly did in bright green to highlight that this is a 60min pincher chart
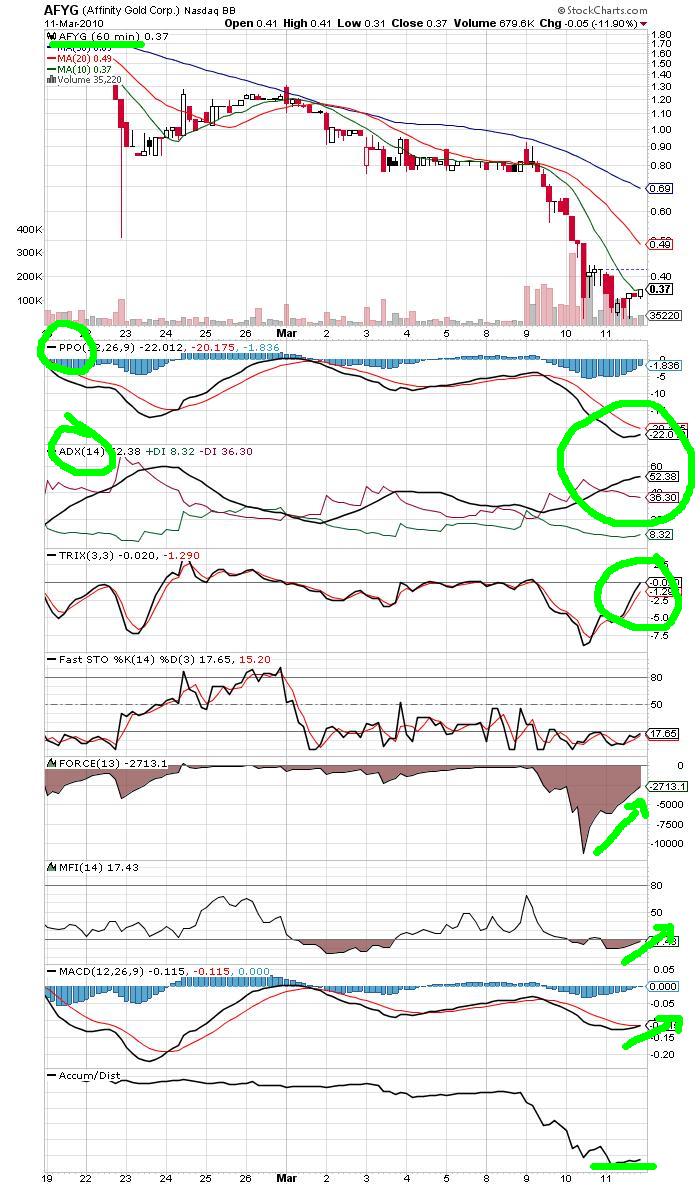
Synth and Joe (interloper too) - ran out of messages for the day so I had to wait -I have attached the image with my own bright green arrows pointing to 3/11's ADX and PPO which are pinching TIGHT. Am I really going crazy or are you guys just not looking at my chart? This is a pincher! I wouldnt post it here if it wasnt. Anyway - Ill stick to posting daily and weekly pinchers from now on and skip posting my 60min ones-
interloper: sorry to clutter the board with a pincher that doesnt show up on your daily chart-

Anyway - concerning daily pinchers - looking forward to a great day on HLXW and an even better one on ARYX! in both
good luck all!
AFYG Pinch starting to form. Spinning top candle could mean reveral tomorrow. Who knows ;)
Haha. Synth I just read your quote on your profile its hilarious! :) Good stuff.
MDVN is a pincher. Where is a good price to buy I don't know. I still have not figured out how to play the gap down stocks in terms of pincher plays. They don't seem to follow the same trends as stocks that have large drops in price without a gap down. Other people here seem to have better luck with them though, so maybe they can help.
Noticed that some of the Bear funds(qid, faz) are starting to get closer to pinching and my mkt timing indicator is very close to signaling a reversal to the downside. Just FWIW and IMHO,,,lol.
well...I guess everyone that comes here to "the HOUSE of PINCHERS" to see and talk about pinch plays cares. if everyone wanted simply bullish charts then we would all go to "the house of simply bullish charts" :P
still not much of a pincher to me either. it moved though, so who cares.
MDVN do you think this might be a pincher?
Yeah, I can see your chart. March 2nd? Is that where you see a pinch in the PPO / ADX ? I guess I tend to see the more dramatic, obvious stuff. hehe
Nice play today. And yeah, ARYX should pop tomorrow with a PPO crossover. NVLT has some time too-- green day today helps.
I wouldn't be surprised to see aryx gap tomorrow. Testing top of ascending triangle here. IMO
lol - yes - Ive been in ARYX and NVLT for their DAILY pinch chart for around a week now. ARYX looks like its finally going to burst and NVLT looks like its got another week in her.
Did you set your chart to 60min and length to 15 days??
you dont see this?
Looking at your chart, but still...PPO and ADX parallel (never pinched). PPO way positive. Got a great bounce off the 50-day MA support. Still, nice profit today. Congrats
I'm used to looking at "pinchers" more along the lines of the oversold, bottom bouncers. Clinical example:
http://stockcharts.com/h-sc/ui?s=ARYX&p=D&yr=0&mn=3&dy=0&id=p68963334058
Check out the PPO / ADX on that one, and the RSI.
I picked up WDRP and AFYG this morning for their 60min charts - flip your sharp chart down to 60min and tighten the time frame to 10-20 days or so - or click on this one-
http://stockcharts.com/h-sc/ui?s=WDRP&p=60&yr=0&mn=0&dy=25&id=p78350694292
WDRP going parabolic today - hope some of you picked some up this morning! up 65% since I posted that chart-
from .0115 to .019 now
Golden Cross going into tomorrow-
Am I missing something? I don't see a WDRP pinch on the chart. RSI was not oversold. PPO and ADX are running parallel (not pinching). Sitting on the 50-day MA for support (rather than sitting well below, like most pinchers). Looks like a bullish stock, but a pincher?
http://stockcharts.com/h-sc/ui?s=WDRP&p=D&yr=0&mn=3&dy=0&id=p89455381704
WDRP looks like someone cut open that pinch and it is just splitting open. stochastics up, mfi up, macd turning up - looking solid.
http://stockcharts.com/h-sc/ui?s=WDRP&p=60&yr=0&mn=0&dy=25&id=p78350694292
WDRP and AFYG getting more traction! WDRP really getting some buying volume coming in! she's turned positive on the day already - a lot more room to run though
WDRP/AFYG - looking great now! AFYG ask wont budge below .35. looks like this is as low as she goes. WDRP bottomed this morning and is now just about to climb out-
AFYG
http://stockcharts.com/h-sc/ui?s=AFYG&p=30&yr=0&mn=0&dy=15&id=p99289640534
WDRP
http://stockcharts.com/h-sc/ui?s=WDRP&p=60&yr=0&mn=0&dy=15&id=p60486603881
HLXW has some good volume coming in.. Possible pop soon
Solid volume on PDGE. Could made a big move here.
In DRLY .065. Nice looking pincher.
TGGI = ouch again. Yep, unwise entry. I'll hold for now.
|
Followers
|
792
|
Posters
|
|
|
Posts (Today)
|
0
|
Posts (Total)
|
58646
|
|
Created
|
07/06/07
|
Type
|
Free
|
| Moderator charger | |||
| Assistants pj McMulligan Tina wolfgangrene jimmenknee interloper | |||

 Thank you EVERYONE for making us a HUGE success! You guys ROCK.......let's keep making lots of $$$$
Special thanks to Durkkdiggler for his awesome job with the ibox header!
Please visit him here: Diggler's House of Images

PPO & ADX

Definitions:
The PPO (Percentage Price Oscillator) is a momentum indicator that tells us the percentage, above or below the long-term indicator, that a stocks price falls. So, when the PPO ‘pinches’ it was at -40%. This means that the stock was trading -40% below is long-term average price. It was grossly oversold.
The ADX(Average Directional Index) is an indicator that shows the strength of a trend. Measured on a scale from 0 to 100, values below 20 are considered weak and values above 40 are considered strong. It is important to understand that the ADX does not indicate whether a trend is bullish or bearish only it’s strength


Good scans to get you started!
Charger's Scan (Stockcharts) - http://investorshub.advfn.com/boards/read_msg.aspx?Message_id=33854076&txt2find=scan
SimpleGreen's Scan (Stockfetcher) - http://investorshub.advfn.com/boards/read_msg.aspx?message_id=31539713
Crable's Pincher Scan (Stockcharts) - http://investorshub.advfn.com/boards/read_msg.aspx?message_id=35020410
Starter Scans (Stockcharts) - http://investorshub.advfn.com/boards/read_msg.aspx?message_id=35047573
captain america's Scan (Stockcharts) - http://investorshub.advfn.com/boards/read_msg.aspx?message_id=35233571
![]()
People often think that pinchers are only for BUY signals and not SELL signals unless the candle breaks down the MA(20). If someone tells you this, please remember that Soapy told you to slap such people and call them an idiot to their face. Also people often think that the PPO/ADX pincher is the king of pinchers (which may be true) but such pincher plays require the MA(20) to be your "golden egg" stop loss. But this too is utter nonsense when playing a pattern given a pincher. For example, consider the chart below for Deckers Outdoor Corporation in which a rising wedge can be seen using the green trendlines. As we all know, such a wedge is inherently bearish and needs a sound exit as to retain a profit. But how does a pincher tell you when to exit?
Unlike entry, which can be a total pain, the exit is quite simple to nail given the ability to look beyond the ADX/PPO pincher which has NO INFORMATION on when to exit other than: "Oops, we hit the MA(20) and I just lost considerable gains. DOH! I feel like I rode FFGO and GLCC back to 0.0001!" Since we're here to make money, we don't want to be the MA(20)-idiot that gave up 30% of profit due to an ineffective stop loss methodology. Thus we should consider appealing to a pincher as a signal to jump ship and take profits. The trick to this is to look at the PVO/STO pinch as a signal to exit. The chart below illustrates how to find such a pinch and is pretty much the entire story. So, please keep in mind that an ADX/PPO pinch may tell you when to enter, but the PVO/STO tells you when to exit if and only if you can define a pattern for the candlesticks. Also, for those who want to exit at the top of a swing, notice how the exit keeps you above the MA(20); an exit leaving more profit in your pocket.
Happy Trading.

![]()
|
Posts Today
|
0
|
|
Posts (Total)
|
58646
|
|
Posters
|
|
|
Moderator
|
|
|
Assistants
|
| Volume | |
| Day Range: | |
| Bid Price | |
| Ask Price | |
| Last Trade Time: |


