 News
News  Market Data
  Discover
Support: 888-992-3836
Copyright © 2023 InvestorsHub Inc.


Register for free to join our community of investors and share your ideas. You will also get access to streaming quotes, interactive charts, trades, portfolio, live options flow and more tools.
$TMXN Saavy Naturals products are 100% natural, vegan, gluten-free, soy free, cruelty-free, non-GMO, and food-grade.
$GRWC About Lake Selmac Resort:
Lake Selmac Resort
2700 Lake Shore Drive
Selma, Oregon, 97538
Can anybody tell me the best custom stock scan sites. I am looking for something that can give me something like day 5 day sma crossing the 20 day sma or something like that that I can custom.
Thanks
Matt
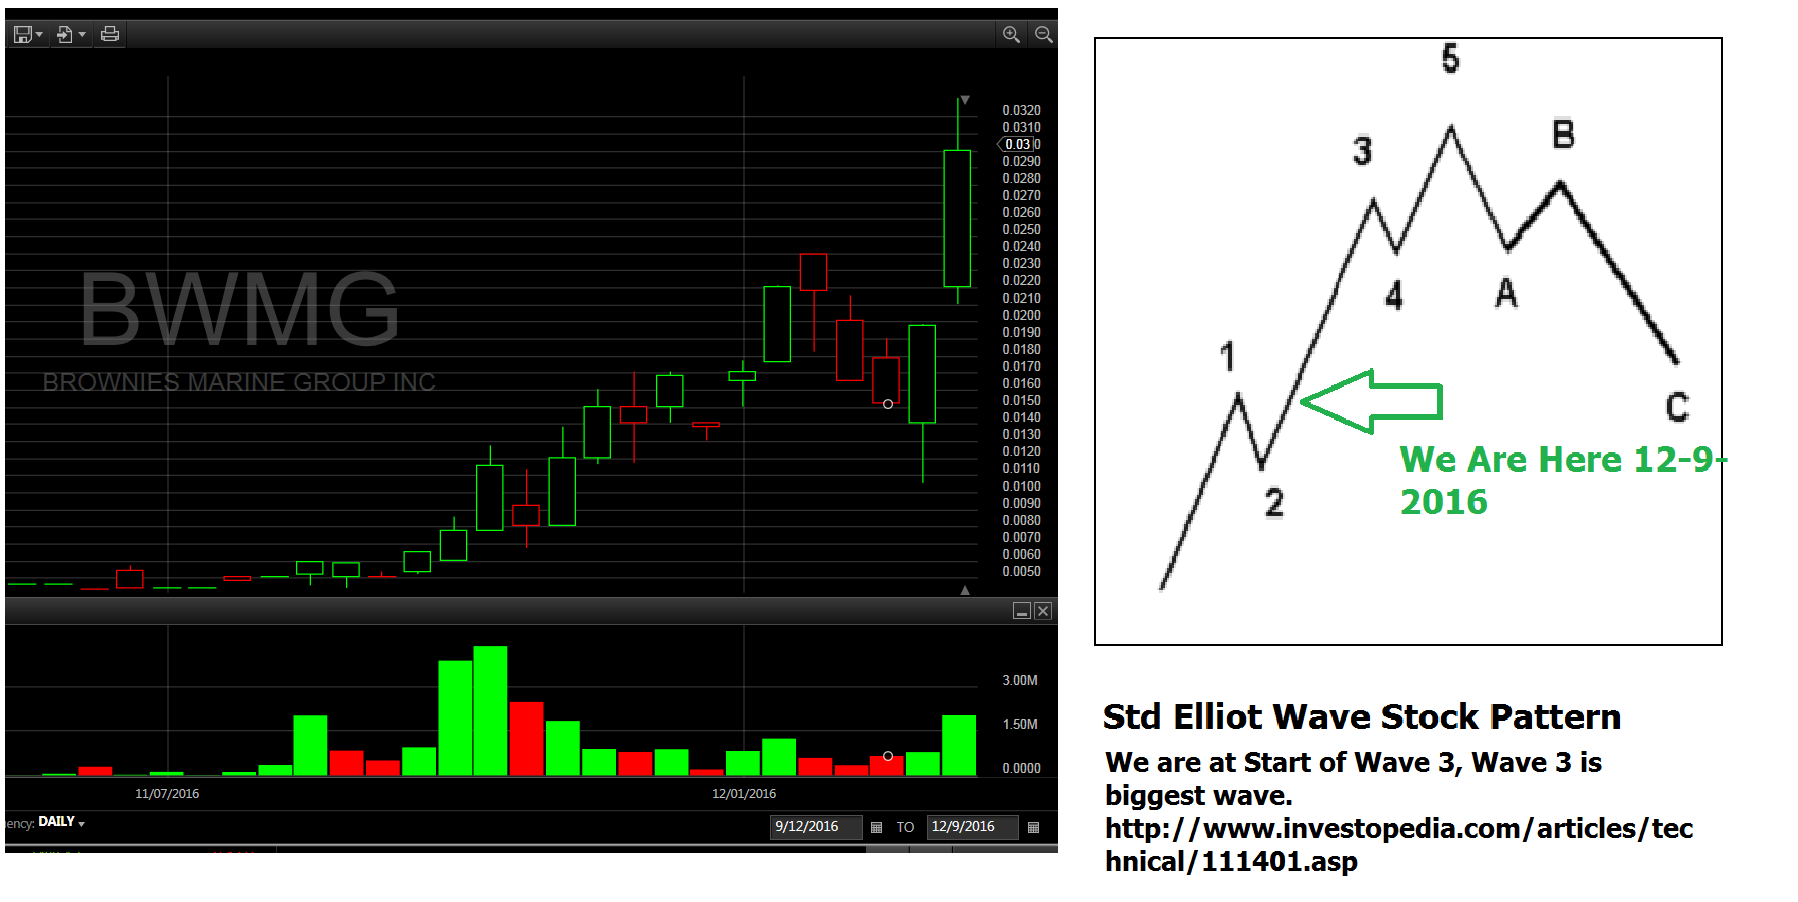
How does Chart Look-BWMG After 6 Bagger?
Still just 6PE stock after 6 bagger, it started at 1 PE. Due to tiny float it is moving real easy and I did post it here before rally took off.
Wave count looks great here.
Click for bigger version
$BFGC The Company has access to Barrick’s large data base, including 157 miles of drilling in 1,298 holes, heap leach test work and much additional data that support the Project. In this regard, it would cost much more than $40 million to re-create this very large data base.
$GRCU Icon Beverages will make up the beverage division of GRCU which will feature celebrity iconic notables who are recognized worldwide.
$RMHB Rocky Mountain High Brands, Inc. (OTC: RMHB), a consumer goods company specializing in brand development of health conscious, hemp-infused food and beverage products., announced yesterday that a new audio interview with the Company, is now available.
$GNRSF is going social, mark its Facebook Profile page for latest updates!
https://www.facebook.com/lagunablends
#lagunablends $lag $gnrsf $LB6.F #pro369 #caffe #hemp #protein #beverage #otc #stocks #otcbb #coffee #mlm #invest
MSPC Long-term Local thinking
•Creativity in Business Execution and Processes
•Access Across Many Different Capital Markets
IEGH CONTACT Address:
6160 West Tropicana Ave
Suite E-13
Las Vegas, NV 89103
FDBL Today just about everyone is on the move and interacting online with their mobile devices, creating dynamic opportunities to find and explore new experiences with location specific accuracy.
SRGL Gain customers the time tested way. They earn them. It is who they are.
$EPAZ on your watchlist yet? $EPAZ's BoxesOS provides many of the web-based applications organizations would have to otherwise buy separately.
EPAZ Easily select attachments from your file manager account
EPAZ Epazz, Inc. is a leading cloud-based-software company that specializes in providing customized cloud applications to the corporate world, higher-education institutions and the public sector.
NERG Nutech Energy Resources, Inc.'s development of proprietary equipment uniquely positions the Company to be able to acquire and profitably operate wells that were previously cost prohibitive.
BTFL "Partnering with Monarch America's marijuana consulting business to design and operate our new medical marijuana facility in Honolulu will allow us to leverage their industry knowledge and unique hands-on operational experience," stated Tak-Sang Cheng, Managing Partner of Malama Wellness, LLC.
$WDRP announced its capital raising and stock retirement plan as part of the new growth initiative.
http://www.wanderportcorp.com/news/
https://twitter.com/wanderportcorp
FSNR Chart looks very bullish on recent good news, check out the RSI, looking strong at 67. MACD moving up high on the chart too.
FSNR chart:
http://stockcharts.com/h-sc/ui?s=FSNR&p=D&b=5&g=0&id=p03066962511
Also note that FSNR is trading well above both the 50 day MA and also the 200 day MA.
Good news last Thursday on FSNR / Dynamis new JV and the purchase of the CTR facility for Petrozene production and other valuable products.
FSNR is now a new Petro Chemical manufacture
Latest good news:
Freestone Resources and Dynamis Energy Announce Joint Venture to Vertically Integrate the Petrozene Product Line News link:
http://finance.yahoo.com/news/freestone-resources-dynamis-energy-announce-130000699.html
$INOL Weekly Chart .. good chance of getting back into .001s!
Xylitol Canada, Inc. [$XYLTF] due diligence via ddnotesmaker.com
DD Notes ~ http://www.ddnotesmaker.com/XYLTF
BICX Once medical intervention has reduced the physical need for alcohol or opioids, the program goes on to address the patient’s psychological needs. The combination of these treatments has resulted in the highest chance of sobriety.
Any thoughts. On gold, silver, copper, oil, specifically
Rgld, slw, scco, erx or iye
All are things near a bottom.
I dont buy penny stocks and in general prefer funds
Toofuzzy
R
SCON - 2015 top pick - High temperature superconducting wire
Two years late but finally turning new technology into commercial production.
Proprietary leading edge technology for high temperature superconducting wire.
Company website
http://www.suptech.com/home.php
No need for cash – They cancelled their existing shelf registration after a dilution in 2013.
First commercial deal to come coming months.
Start production in Q4 2014 and ramp up production in Q1 2015.
Now in order to do that you must have client specifications for the wire they want.. and in order to ramp production doing so… you need a commercial deal.
Which I expect in the near future now
- Production process consists of three pieces of machinery. Final third stage machine installed in late august 2014, installed in September and being tuned in.
- One commercial production line of kilometer lengths has roughly capacity for 750 kilometer of wire per year
- Rough revenue projection for 750km of wire ~ 35 million dollar per year
- Highly scale-able : any new production line will take roughly 8-11 million in machinery
- Many sample wires already sent on their smaller 50meter pilot machine in the past year.
- No debt
- No existing shelf registration
- Existing warrants in place
- Fairly low volume here and about 1.7 million shorts
Technicals: low volume daily chart , nicely bottomed for this smallcap.
More interesting is the weekly chart:
http://stockcharts.com/h-sc/ui?s=SCON&p=W&b=5&g=0&id=p90089240728&a=366926965
Great Looking chart! ** $CIGW ** Penny Stock Mobsters Gotz A Higher Priced One For Yiz
Takes A Look @ CIGW - Reporting $1.6M In Revs Last Qtr
Company Profile: http://bit.ly/1u1rzXi

$CIGW ~ Annotated Daily Chart
>> http://investorshub.advfn.com/boards/read_msg.aspx?message_id=104830228 <<


Profile: http://investorshub.advfn.com/boards/read_msg.aspx?message_id=104825134
Chart: http://stockcharts.com/c-sc/sc?s=CIGW&p=D&b=5&g=0&i=p49642635610&r=1398803230510
Recent News: http://finance.yahoo.com/q/h?s=CIGW+Headlines
$PLWY Peoplesway is building on its strong heritage - even selling one of the original products from that skincare line. Led by a management team with more than 100 years of combined experience, the company has a new focus and a broad vision for the future. Peoplesway has set its sights on becoming a leader in the wellness revolution, helping people to achieve financial independence and an unprecedented level of health and vitality.
$OCEE about to breakout on chart @ http://www.barchart.com/opinions/stocks/OCEE
$DGRI Dutch Gold Resources, Inc. Financial Services for the Medical Marijuana Industry. $DGRI this company has changed the business model from gold stock to MMJ stock !! Expect more updates from $DGRI on MMJ soon!!!
$ZRSCF is projected that the head grade will be a minimum of 2.5 gms of gold per ton, which will generate 2 Kilograms (63 ozs) of gold per concentrator per month. The company is starting with 2 concentrators in the first six (6) months and expects to expand to 4 concentrators by the end of the first year. The revenue generated by the portable concentrators is in addition to the revenue projected to be generated by the mill which has a capacity of 50 tons of ore per day.
$FDMF Technical Opinion from Barchart.
http://www.barchart.com/quotes/stocks/FDMF
$ECDP's Watergeeks was on the NBC "Today's Show" as a TOP 10 gift idea!
http://goo.gl/3xaXxh
$NXTD Recent Development:
NXT-ID Patents the "Un-Password"
A Dynamic Authentication and Encryption Method to Reduce Data Breaches and Fraud
http://finance.yahoo.com/news/nxt-id-patents-un-password-124231902.html
SHELTON, CT--(Marketwired - Mar 20, 2014) - NXT-ID, Inc., (OTCQB: NXTD), a biometric authentication company focused on the growing mobile commerce market, announced today that it has submitted a patent application for dynamic pairing. As a follow up to U.S. provisional patent application No. 61/802,681, NXT-ID has filed patent application 14/049175 for
THE "UN-PASSWORD™: RISK AWARE END-TO-END MULTI-FACTOR AUTHENTICATION VIA DYNAMIC PAIRING.
This patent represents advancements in biometric and cryptographic authentication, and another key technology to NXT-ID's widely anticipated next generation payment and identity product -- the Wocket™.
Dynamic pairing addresses several vulnerabilities facing current authentication methods. These include "brute force" attacks, where attacking computers systematically check all possible passwords until one is found, and "man in the middle" attacks, which caused the Target and other recent retail data breaches where the attacker impersonates each end point to the satisfaction of the other.
"We wanted to develop a method where devices could establish trust with one another, but without exposing any private information that could be used in an attack or identity theft," says David Tunnell, CTO of NXT-ID. "Instead of passing private, identifiable information about an individual over the internet, we send dynamic pairing codes that contain hidden risk assessments. Each new risk assessment measures how sure 'you are who you say you are' based on multi-factor authentication such as biometrics. Since each new risk assessment is dynamic and hidden within the dynamic pairing code, it makes cyber attacks extremely difficult and easy to detect, while enabling authentication and encryption across remote devices and services."
Dynamic pairing is flexible, easy to implement, and brings a high level of trust to transactions without sharing any private information that could be used for cyber attack. With dynamic pairing, private data is kept private, under the control of the owner of the data where it belongs so that your identity cannot be stolen, while still enabling other systems to trust the authenticity of a user, device or application.
"We believe dynamic pairing could change the way access is given in a vast number of applications and help to prevent substantial losses in the financial payments industry," says Gino Pereira, CEO of NXT-ID. "Dynamic pairing can make a significant difference in identity management and secure communications while enabling individuals to keep their critical and private information from being stolen. Our first application of this innovative technology of course will be our Wocket™ Smart Wallet."
Wocket™ is a new biometrically secure smart wallet designed to replace the traditional wallet and the number of cards consumers carry. Its dynamically programmable magnetic stripe, NXTCard can replace up to 20,000 cards and can include medical records, ID, coupons etc. that are currently kept in a wallet, with one single secure card. Wocket will feature interchangeable accessories, which are direct attachments, to offer various styles, textures and colors to support a variety of common uses including carrying cash. Wocket™ is a smart wallet that can completely replace your existing wallet with more functionality, comfort, style and security.
Here is PEIX chart! I might as well start posting some charts!!
http://stockcharts.com/h-sc/ui?s=PEIX&p=60&b=5&g=0&id=p69098665365&a=345522361
GLTA
ID
Republic of Texas Brands $RTXBQ has launched its new corporate website http://www.cannabis-holdings.com and is now accepting orders for cases of the CHILLO hemp based energy drink.
- RTXBQ is in the process of setting up a Texas based distribution network for CHILLO and plan to announce more on the progress as soon as the deals are signed and the first products are shipped.
- RTXBQ is already in various stages of discussions with other reputable hemp and medicinal marijuana operations to complement the existing product line.
![]()
The Live Deal smart phone app is out.
If you don't know what it is, just download the Live Deal app from the Google App store. Then, hit the app, and it will direct you, immediately to restaurants in your area that are doing immediate discount deals. Who doesn't like to go out for dinner or drinks and get a discount.
The Apple Iphone and Ipad App comes out very soon.
It is also a great investment opportunity, so grab some shares, make some money, and save some money at the same time.
For more details:
http://investorshub.advfn.com/Live-Deal-Inc-LIVE-2309/
$EMBR HUGE Cannabis Premarket News! Embarr Downs Inc. Announces Approval of New Label for Its New Cannabis Market Product
http://finance.yahoo.com/news/embarr-downs-inc-announces-approval-110000217.html
Embarr Downs Inc. (EMBR) announced today that the Company has approved its new label for Hemp Fish Water. Hemp Fish Water is manufactured from the waste water from the Company’s aquaculture ponds and used as organic and natural liquid fertilizer that can be used every day and can replace normal watering. The initial market for the product will be small medical marijuana farms and will be expanded to small and home based gardens. The Company expects initial test shipments to begin in the next 2 weeks.
Looks like that $1.25 downwards gap might fill. Think I'll bite on this, thanks for the heads up.
$POIL has a lot of potential to make a technical bounce move! 60mil O/S only!
$KIMJF very small market cap! See share structure
Market Value1 $10,000,000 a/o Mar 24, 2014
Shares Outstanding 500,000,000 a/o Mar 03, 2014
Authorized Shares 500,000,000 a/o Mar 20, 2014
VMGI Lights! Action! and a Bullish Smoke!
Verde Media Group Inc. is a publicly traded company listed on the OTC Markets trading under the stock symbol: VMGI. Verde Media Group Inc.

RTXBQ Just found out you can get a deal of the day at groupeedeals.com at a discount not found anywhere on CHILLO! Was on last PR They ran out of Chillo!
RTXBQ after delivery! Did not know some of the things I am finding about Hemp Oil and therapeutic benefits! I think if anything here is true at all by previous posts of mine this is great! IMHO Amazon link for Republic of Texas Direct here!

http://www.amazon.com/gp/aag/main/ref=olp_merch_name_1?ie=UTF8&asin=B00DE1EZMG&isAmazon
Fulfilled=0&seller=A2KX6CKNKJOQAL
RTXBQ have to say unbeknown to me I have had a little numbness in my left foot and I don't know if it psychological or what maybe its the research I am doing but I feel great from a little bit of CHILLO so far no BS not kidding! Only 4 cans so far! Maybe the hype but I do!
OTCQB: EPAZ EPAZZ, Inc.; Cloud Business Software
Epazz Inc. is an enterprise-wide software company that specializes in providing customized web applications to the corporate world, higher education institutions and the public sector.
Epazz’s unique BoxesOS applications can create virtual communities for enhanced communication, provide information and content for decision-making, and create a secure marketplace for any type of commerce all through the medium of the Internet.
Epazz is the answer to the increasing information technology demand of the 21st century.
Epazz is demonstrating substantial growth in a competitive industry.
$POIL ~ Growth Overview
http://www.poil.us/growth/
Pacific Oil’s growth strategy can be broken down into two key sections; organic and inorganic. Resource allocation is based on a balanced approach between the two in order to facilitate risk control in the form of diversification. The management of Pacific Oil is committed to aggressive growth but is mindful to not over stretch available capital and operational man power.

$SING Description
SinglePoint provides mobile marketing and mobile payments via SMS (text) message. Create and direct targeted marketing campaigns through the interactive media of text message. Accept payments and donations from customers anywhere, anytime directly from their mobile device. Enjoy the benefits of cloud based technology easy enough for anyone in your company to use. Simple and Effective.
CNR e-mail blast low float china play
http://stockcharts.com/c-sc/sc?s=CNR&p=D&b=5&g=0&i=0&r=1393013671294
$HNSS Business Description
Healthnostics is a medical products manufacturer, system manufacturer, product distribution and consulting company.
$POIL's Corporate Website is: http://www.poil.us ; tons of good details

|
Followers
|
457
|
Posters
|
|
|
Posts (Today)
|
0
|
Posts (Total)
|
16548
|
|
Created
|
07/28/10
|
Type
|
Free
|
| Moderator Matt_Chart | |||
| Assistants ~BC~ SmarTrader fast.money | |||

Triangles are important chart patterns. They offer very good probability for continuation of a trend when the price breaks from this pattern.
Ascending triangle
This version of a stock chart pattern is considered bullish. It has very good reliability if it is found in an uptrend . As you can see in the illustration, there is horizontal resistance at highs and a rising support line at lows.

Descending triangle
This version of a stock chart pattern is considered bearish. It has very good reliability if it is found in a downtrend. The resistance is a declining downtrend line, and support is at the horizontal level.

Flags and pennants are very solid stock chart patterns. They signal very good trading opportunities.
I like these chart patterns, and a lot of other traders agree that they're the most reliable chart patterns.
They're known as continuation stock chart patterns. You can find them after a strong trend move. These patterns represent consolidation and little sideways movement. When the price breaks from the pattern, then the trend resumes again.
The bullish version has lower lows and lower highs against the previous main trend direction. Trend lines for highs and lows are parallel.

The
bearishtype of pattern is based on higher highs and higher lows against the major trend.

have another design. Trend lines are not parallel, but they're going to meet at one point. This pattern is smaller in size and also needs less time to develop.

Head and shoulders is a bearish reversal chart pattern. It finishes an uptrend move and starts a downtrend move.

The Left shoulder and head are created during an uptrend. The price retraces all the way down from the top of pattern, it means
100% retracementof a head uptrend move. This is first warning sign. It shows that the uptrend is weak.
Then, the right shoulder forms. A lot of supply is available from previous buyers in a head uptrend and creates a lower high, that is, the right shoulder. This is the last warning sign that the uptrend is finished.
Inverse head and shoulders pattern
This is a bullish version of this chart pattern. The same rules work for this version as for the bearish version above.

What Are Elliot Wave Cycles?
Please read, these cycles happen very often in penny stocks.
http://www.forexhit.com/learn-forex/elliott-wave-principle.html

JAPANESE CANDLESTICKS

Charting tools
http://www.stockcharts.com
http://www.chartpatterns.com
http://stockcharts.com/education/IndicatorAnalysis/
http://www.investopedia.com/categories/technicalanalysis.asp
http://www.candlesticker.com/Default.asp
http://candlestickforum.com/PPF/Parameters/16_332_/candlestick.asp
http://www.incrediblecharts.com/technical/candlesticks.htm
http://www.chartpatterns.com/
http://www.investopedia.com/university/technical/techanalysis8.asp
http://stockcharts.com/school/doku.php?id=chart_school:technical_indicators
Disclaimer
Opinions expressed on this board are just that. Opinions. We are not a licensed brokers. Trading strategies discussed on this board are often high risk and not suitable everyone. If you are losing money in the market, you may wish to seek the advice of a licensed securities professional.
No one is responsible for your gains or losses in the market except you!
If you follow stocks, strategies discussed on this board, you may lose all your money. Please weigh the strategies discussed here carefully against what you are willing to risk.
Please do your own due diligence before buying or selling any security in the open market, there are no guarantees.
|
Posts Today
|
0
|
|
Posts (Total)
|
16548
|
|
Posters
|
|
|
Moderator
|
|
|
Assistants
|
| Volume | |
| Day Range: | |
| Bid Price | |
| Ask Price | |
| Last Trade Time: |


