 News
News  Market Data
  Discover
Support: 888-992-3836
Copyright © 2023 InvestorsHub Inc.


Register for free to join our community of investors and share your ideas. You will also get access to streaming quotes, interactive charts, trades, portfolio, live options flow and more tools.
HI! I'LL BE POSTING MOST OF MY CHARTS & ANALYSIS ON LG'S NEW MDA BOARD, WHICH CAN BE FOUND AT #board-1320
Regards,
augieboo
(:

My Threads --
Archive of Trading Stuff #board-1220
PPT Archive #board-1280
COMP 60 MIN W FIB NUMBERS
(:
My Threads --
Trading Stuff #board-1220
Index Charts #board-1246
PPT Archive #board-1280
Gold #board-1240
NASI-COMP Study #board-1263
I think you just answered that question, i.e., WWBD?
(:
augie
I'm selling at the first signs of a downbar.
Lots of stuff, so stay tooned, and keep asking yourself, WWBD?
(:
augie
What are all your charts telling you?
I've been thinking bumper stickers for awhile now and still don't get it.
WWBD? Think bumbperstickers...
(:
augie
Oh my! WWBD?
(:
augie
An old message board wakes up!
Augie, I'm not sure those rectangles/flags are relevant anymore. We've reversed, and we're probably going up for now.
That's pretty good eye-balling on the SOXX. I measure it to 283. But I don't see a rectangle on the BTK. What time frame are you looking at?
http://stockcharts.com/def/servlet/SC.web?c=$SOX,uu[g,a]daclnyay[db][p][vc60][J5211351,Y]&lis...
Here are my goofy NASI studies. Maybe they even mean something. I sure hope so. Otherwise I wasted most of the day for nothing!


Augie, what do you make of those measurements on the SOXX rectangle and the BTK? The SOXX seems pointed to 280 if I'm reading that right, but I don't know how to target rectangles.
HOW TO INTERPRET THE NASI
Summation Indexes
The Summation Indexes, ($NASI for the NASDAQ version, and $NYSI for the NYSE version), are essentially long-term versions of the McClellan Oscillator. Roughly speaking the McClellan Oscillator looks at the difference between the 19-day and 39-day exponential moving averages (EMA) of advancing minus declining issues. For more info on the McClellan Oscillator, go here: http://www.equis.com/free/taaz/mcclellanosc.html
Don't worry about the math, it's not important, IMHO, to be able to calculate the thing in order to use it effectively. The important thing to know is that the Summation Index is a long-term indicator of the trend in advancing and declining issues. As such, it is the best single indicator I know of as to when the market as a whole is deeply overbought or oversold.
How to use the Summation Indexes
The simple answer is to watch the absolute level of the indicator for overbought or oversold conditions, then watch for the indicator to cross over its 20 day EMA within the overbought or oversold range. Okay, so, what is overbought, and what is oversold? That's a good question, for which there does not seem to be a single answer.
Conventional wisdom, (which is suspect because it is not adjusted for for the NASDAQ being different than the NYSE), says:
[1] Look for MAJOR bottoms when the Summation Index falls below -1,300.
[2] Look for MAJOR tops when a divergence with the market occurs above +1,600.
[3] The beginning of a SIGNIFICANT bull market is indicated when the Summation Index crosses above +1,900 after moving upward more than 3,600 points from its prior low (e.g., the index moves from -1,600 to +2,000).
Okay, but that doesn't take us very far, does it?
Vesselin Brontchev, one of the more popular "public posters" on StockCharts.com, suggests (for the NASI only) using crossovers between the indicator and its 20 day EMA as buy and sell signals, as follows:
[1] Buy, (or cover a short position), when when the indicator crosses above the 20 day EMA, preferably, while the indicator itself is below -750;
[2] Sell, (or open a new short position), when the indicator crosses below the EMA, preferably while the indicator itself is above -250.
I think Vesselin's method makes sense, except that I prefer to see -1000 as a minimum. My reasoning is that the NASI is a long-term indicator, so there is no reason to use it to find anything other than longer-term trends, which is, after all, what it is best for.
Hi George:
re: AVNX
It's from my "nearly forgotten memories" file. I don't follow it anymore either, but at one time I was so in love with their technology that I must have programmed the ticker deeply into my subconscious mind -- whenever I need to pull up a chart real quick to use as an example, I always seem to type those four letters. The funny thing is, I can't remember what they do that's so neato. I just remember that in the world of what I call "whiz-bangers," theirs were some of the very whiz-bangiest. <ggg
re: posting charts
Please, by all means, be my guest! I'm always happy to have somebody to compare notes with. (:
augie
Hi augieboo,
Hey I used to invest in AVNX--great technology-but before the need for it returns there will probably be something else. No longer follow it.
The reason the +DI and -DI are not mirror immages on the AVNX chart is because the calculation uses (in part) up and down volume data. On BPCOMPQ, NAHGH, NASI, etc. there is no volume data or maybe the calculation just assumes that vol = 1 everyday. I can't quickly find the formula; however, I have noticed that when sharpcharts is able to show vol data on a chart the +/-DI are not mirror immages and anytime sharpcharts says there is no vol data the +/-DI are mirror immages. ADX is one of Thersa Low's major indicators so I'd like to know if it has any validity in these cases.
I am also trying to find some indicators that will provide a good guide to the market. So far my charts show that I shouldn't have followed Zeve into the market---so I am a bit apprehensive these days.
I assume you would not mind if I post a few charts for your review/suggested modification???
George
Hi George,
I use the black background to cut down on glare and eye strain, but find that the dark blue just adds a different type of eye strain. I had never thought of putting two EMAs on a chart in order to get a brighter color, but you can bet I'll start using it this weekend. (:
As to the RSI & ADX, to be honest, that's just some stuff I'm playing with. I'm trying to figure out if there's a way to tell at least the potential strength of a rally from the Summation Indexes plus various indicators.
As to the mirror image thing, I agree, the RSI certainly does mimic the +DI on my Summation Index charts, but that's not always the case. For example, check out the RSI and the +DI and -DI on this chart:
As you can see, they are similar, but not mirror images. Perhaps there is something about the Summation Indexes which gives this appearance, such as the fact that they are highly "smoothed?" Who knows?
augie
Hi augieboo,
Just a note to say thanx for your efforts to summarize Z's thinking. I've been lurking there for about 6 months. Your charts are interesting. I'm wondering how you use the ADX and the RSI stoch. It seems to me that they are exactly the same information. Check out the green +DI (14) and the orange RSI. And when there is no volume info the +DI and the -DI are just mirror immages of each other, so more lines but no new view on the situation as I understand it. Maybe (probably) I'm missing something of value here, but what????
Also strictly FWIW. I like the black background and use it on my charts. The one problem IMHO is that some colors show up better than others. The color sequence for indicators on sharpcharts is blue, red, green, pink, brown, orange, blue, grey and lighter grey. If you call for an indicator several times, sharpcharts uses the color for the last reference. Its probably easier to try it out than to read it. Your NASI chart uses a blue 20ema which to my old eyes doesn't stand out very well. If you go to your sharpchart and add a second ema20 indicator (don't delete the first one) it should be pink and very vivid. You probably know all this and love blue (VBG), please ccept this in the helpful spirit it is offered.
Thanx again for your efforts
George


 Kelly by herself when she was even little-er.

 Here are a couple pics of me with my two little brothers,
Willow, (left), and Morgan, (right).
Here are a couple pics of me with my two little brothers,
Willow, (left), and Morgan, (right).

 Dollar Index Cash
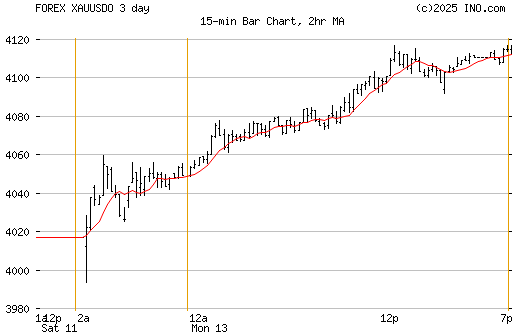
 Gold Spot
 30 Year Bond
| Volume | |
| Day Range: | |
| Bid Price | |
| Ask Price | |
| Last Trade Time: |


