News
News  Market Data
  Discover
Support: 888-992-3836
Copyright © 2023 InvestorsHub Inc.


Register for free to join our community of investors and share your ideas. You will also get access to streaming quotes, interactive charts, trades, portfolio, live options flow and more tools.
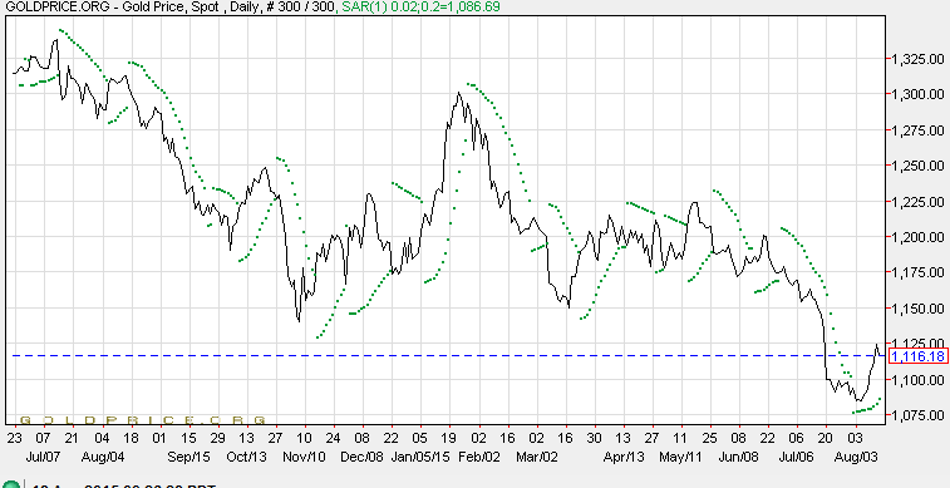
Gold prices burst through 1100, on a rout...
Click image to enlarge.
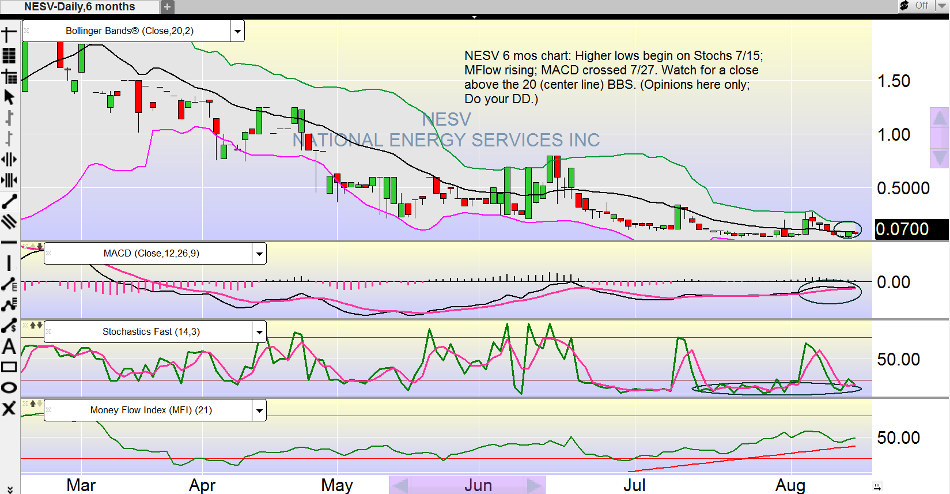
(Posts on Sharpei Deum Charting and All of the Above are just the opinions of posters; not to discourage readers from doing their own DD!!)
Steve: It would be interesting to know how much debt they have retired. (BTW have changed my opinion....)
I've been watching this since you made the call. Looks like it may have bottomed but be careful. I would wait for a retest of the low. It's interesting though.
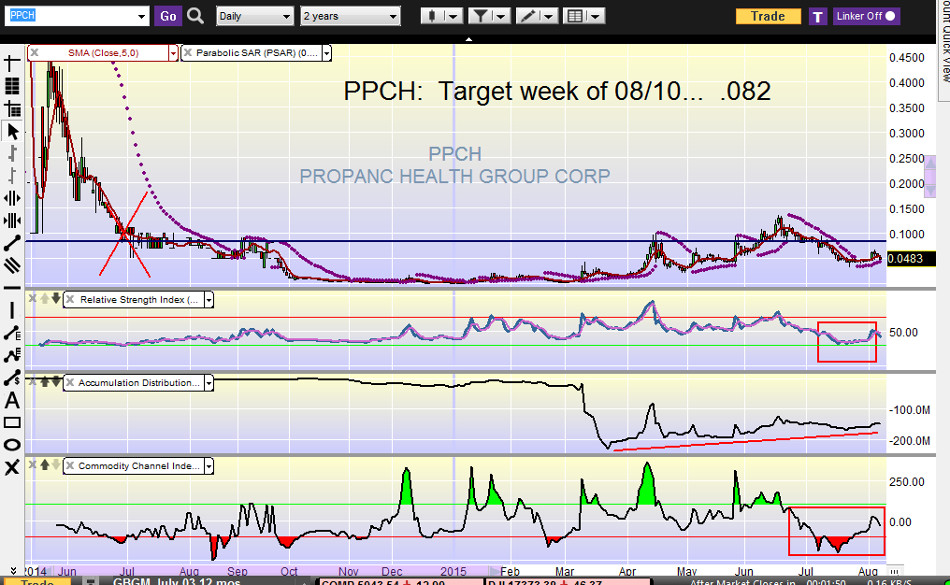
PPCH: It could be that biotech that runs hot and high for you! Setting up for a nic run....

Click on image to enlarge.
BRWC: Water, more precious than gold in many parts of the country. BRWC is moviong up.

Click on image to enlarge.
Thank you, Steve.
I'll be thinking and praying for you.
'Hence that HCTI is now eligible for up to 400k in grant this year alone, from the EPA. '
'2014
"Upon successful completion of the product modifications, Hybrid expects to give worldwide exclusive rights of the modified product to this commercial partner and to retain ownership of the intellectual property." '
'2015
"Upon successful completion of the product modifications, Hybrid will CO-OWN any new patents based on these modifications with this partner and will give to the partner, subject to agreed upon mandatory minimum order quantities to be placed by the partner, worldwide exclusive rights of the modified product for commercialization within the partner's respective industry." '
KEY WORD = CO-OWN
None of this changes the fact that HCTI is the only OTC stock to be awarded by the United States EPA (A federal agency that does not associate with scams)'
http://yosemite.epa.gov/opa/admpress.nsf/a543211f64e4d1998525735900404442/b7cd0898818434f785257e8100580d16!OpenDocument
See July 13 2015; EPA Green Technology Award to nine firms, one of which is HCTI. Price .003. New contract this last week. The OTCQB high risk/high reward.
TY K_W; 'contract w/multi $M company'.
The COMEX agreement you reference seems to be 2 years old and still zero revenue and none planed in the foreseeable future.???
"SAN FRANCISCO, Aug. 5, 2013 (GLOBE NEWSWIRE) -- Hybrid Coating Technologies Inc. (OTCBB:HCTI) is pleased to announce that it has received its first purchase order from Consorcio Comex SA ("Comex")"
Be sure to pay a visit to the Lone Wolf's 'otcrevolution' message board this weekend. Lots of good data on some great plays of the week ahead: http://investorshub.advfn.com/The-OTC-Revolution-29980/
HCTI: 'Hybrid Coating Technologies/Nanotech Industries of Daly City, California, is being recognized for developing a safer, plant-based polyurethane for use on floors, furniture and in foam insulation. The technology eliminates the use of isocyanates, which contribute to workplace asthma. This is already in production, is reducing VOC’s and costs, and is safer for people and the environment'

Click to enlarge image.
So sorry to hear that.. Yes I'm aware.. Be safe...
Hello GMAN: Good to hear from you. You've heard about the fires in CA? I'm in the midst of the largest one on Clear Lake, the Rocky Fire. I will bet back in and post some ELTP soon. I hope you and your family are well. Take care, S!
Sharpei... Where are you???.. Two whole days. I'm having some sharpei TA withdrawals. Hope all is well.
UUP: Undeniable Double top. What will be the affect on gold prices?...Gold hitting close to 1100 multiple times over the last week, not yet able to bust through...yet.
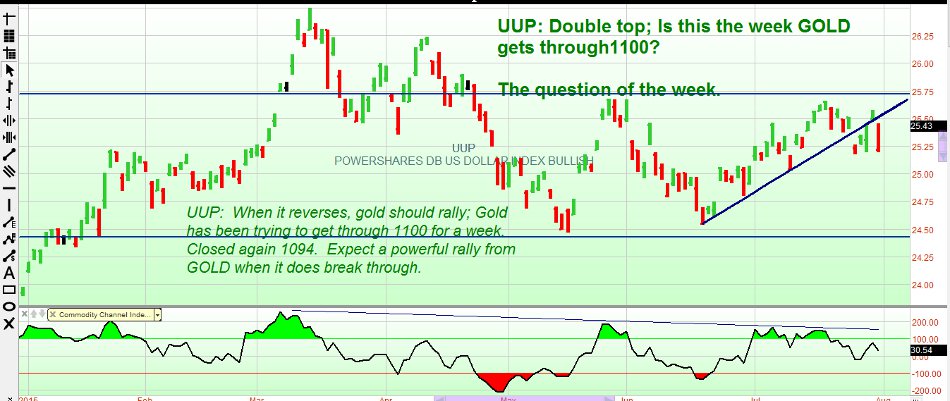
(Click on image to enlarge.
I would call that a break in the trendline....
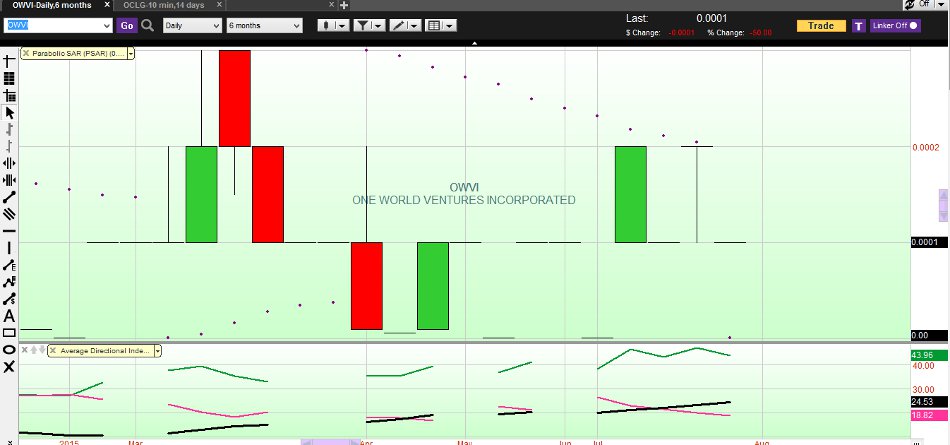
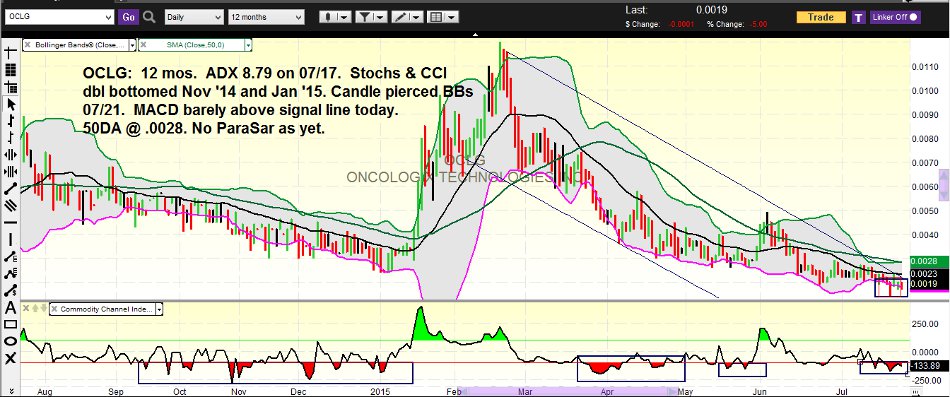
OCLG: The channel just keeps going on and on, and that's a BAD thing?
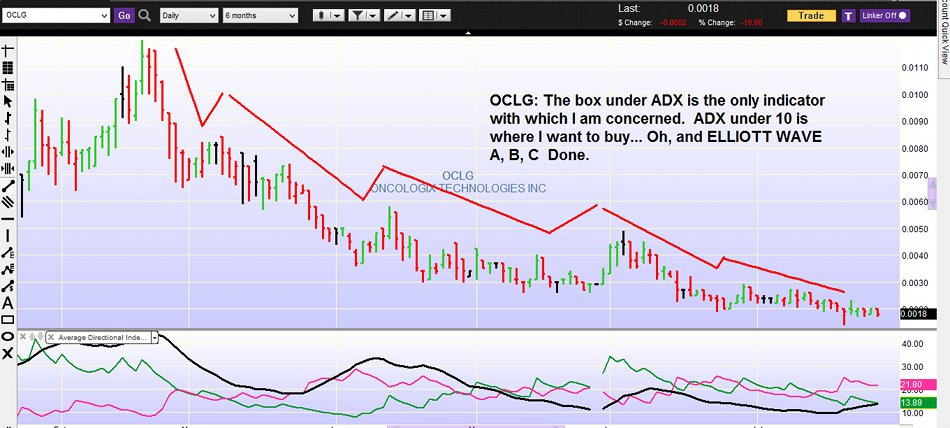
Click on image to enlarge.
OCLG, new ELTP (my opinion.)
Great management; reducing debt; increasing revenue.
Click on image to enlarge.
Do not visit these men's sites unless you want to make money!:
Lone Wolf:
https://twitter.com/otcrevolution; and
SilentPOSLoader:
https://twitter.com/silentposloader
(a recommendation by sharpei. DAMN auto correct, it's Sharpei, not Sharpie!!!!)
IGEX chart thanks to 'ospreyeye' July 22:
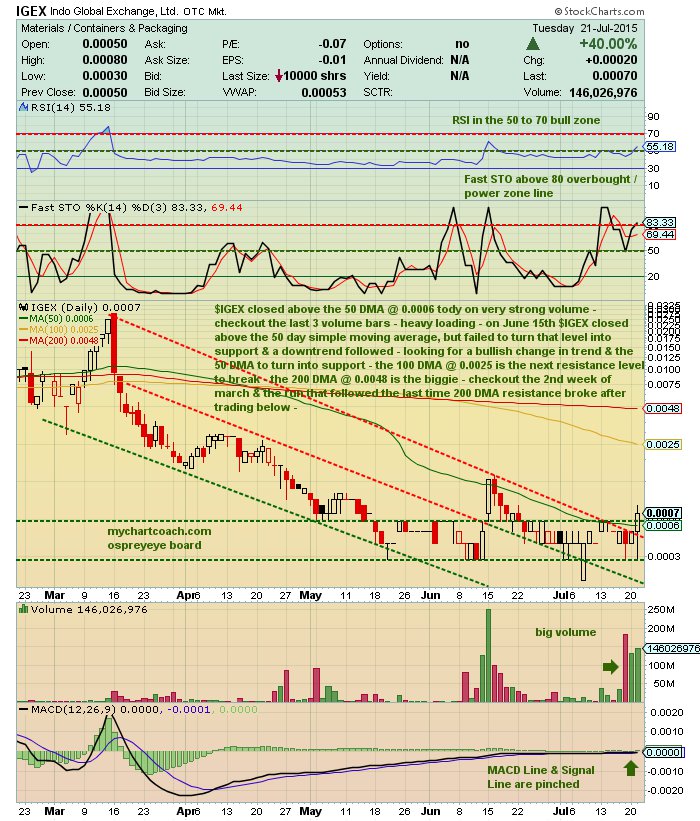
Click to enlarge image.
Thank you for the charts, Conix. Glad to see STWS is showing signs of life!
CHARTS: ELTP, STWS
STWS
Just checking to see what day it is?
IGEX, two charts with details...
Short term (30 mins):

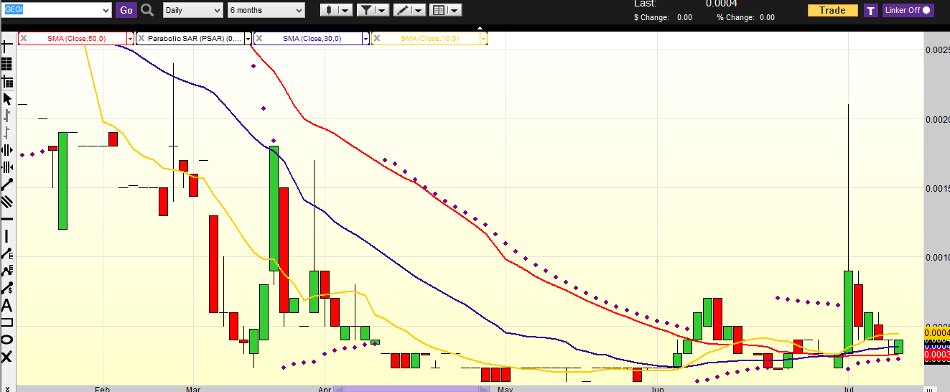
Three Months Chart:
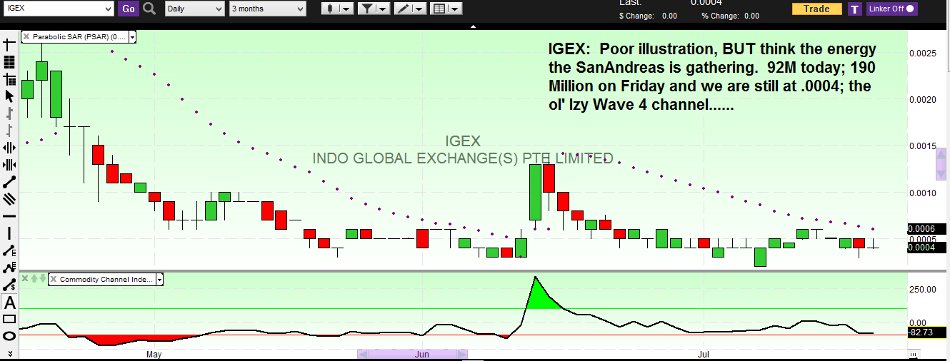
Click on images to enlarge.
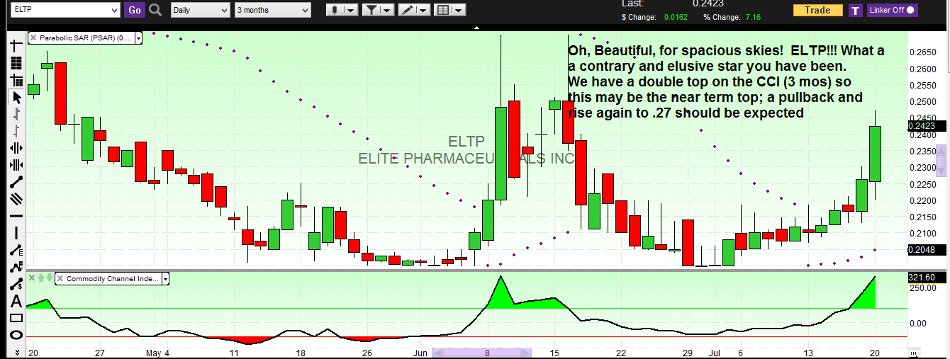
I really believe we hit at least .26 before Wed.All bets off if we get some news tomorrow.(Tues.)
You just got it, NAZ at .245, I believe; now wait for it to come down to the 20 and buy more! GL ALL!!! Uh oh, maybe not. You could go all the way to .27 before a turn around.
Where is resistance with ELTP today?
A few tips on entry.exit targets (excerpt from a post sent to a contact on another site): 'Elliott Wave is a must. Wikipedia is all you need. Now, I have found this to be a learned skill in the sense that it must at some point come second nature almost as it is difficult to detect the breaks and it takes time and a few tricks (Aha! Tricks...shortcuts!!!)
First, study a 6 mo candle chart to see if you can discern where the bottom begins (Wave 1), pulls back (2); then usually, but not necessarily zooms for a longer wave (3); then pulls back and commonly meanders and dips(4); then the topper 5. Then you have the pull back Waves A, B, C. Wiki does a nice job spelling it out.
With EW, you want your Fibonacci #s. Again, you will learn to finesse these. The Golden Ratio, .618 and its multiples; .5 (and its multiples) the typical, but not necessarily is mostly used in retracement; .382 and its multiples is younger brother to .618. (.25, .75, 100%, also are sometimes used, but set them aside for now as they don't come into play so often and are more customarily used with the Major Mkts and Indices.)
For example, I looked at ELTP 6 mos today and the top is .23; if I take .23 divide by 1.08 (Use this a lot when looking for short pullbacks; clue: the 50dma is right beneath it! The result is about .213. So there is your .08 in use.'
My new favorite stock: HCTI Just made its move from .0044 this am. 'HCTI Nanotech Industries International, Inc. d/b/a "Hybrid Coating Technologies" (HCT) is a San Francisco-based innovator focused on improving the quality and safety of coatings and paint for industrial and commercial customers around the world. We are the exclusive licensee of Green Polyurethane™ coatings and paint – the world’s first- ever patent protected polyurethane-based coatings and paint products which eliminate toxic isocyanates from the entire production process (licensed by Nanotech Industries, Inc.).'
isocyanates being the operative word.
HCTI
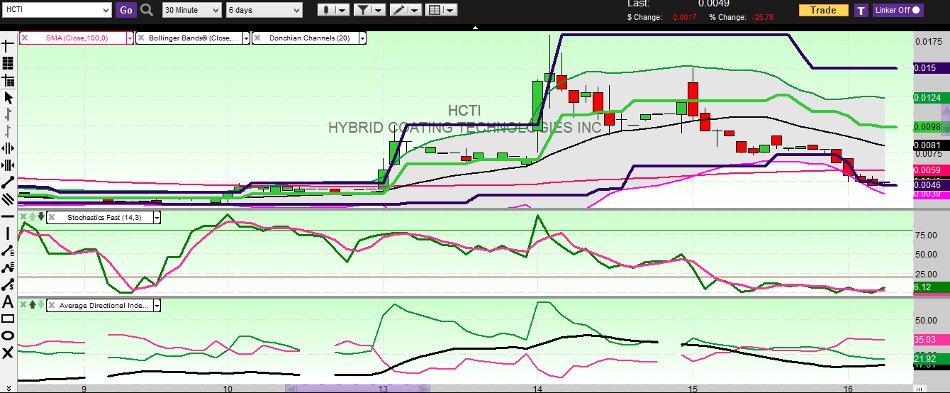
Click on image to enlarge.
Charts and Charts for sub pennies, July 15:
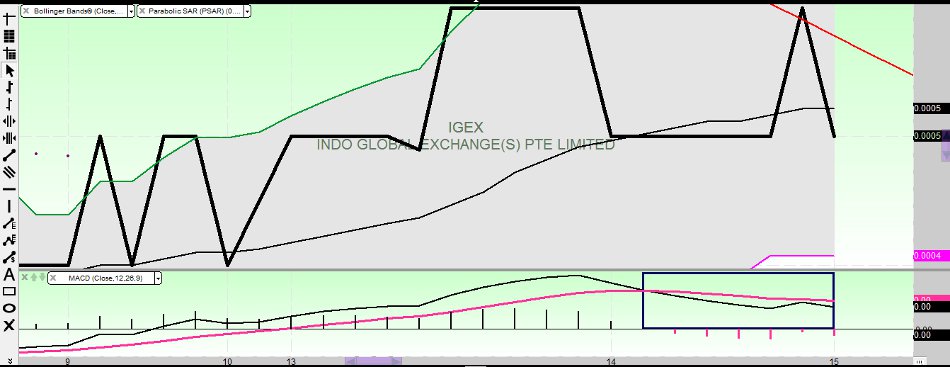
IGEX, prepared to rise from here; volume 4.6mil
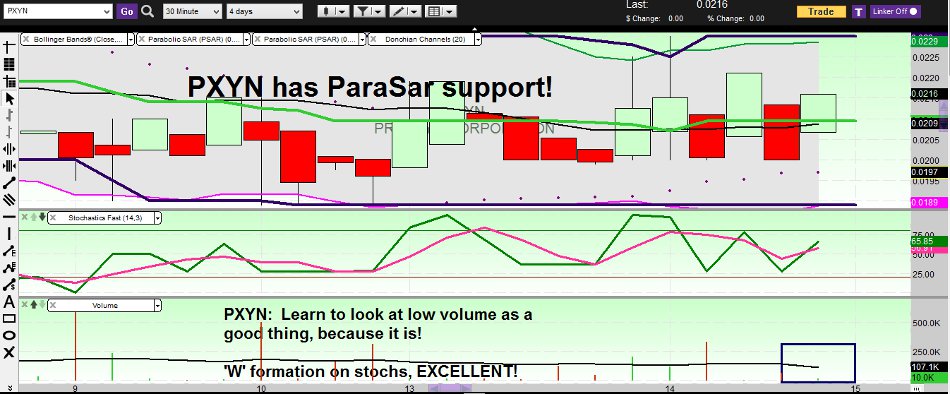
PXYN caught in a Wave 4 channel between .0q9 & ,02.
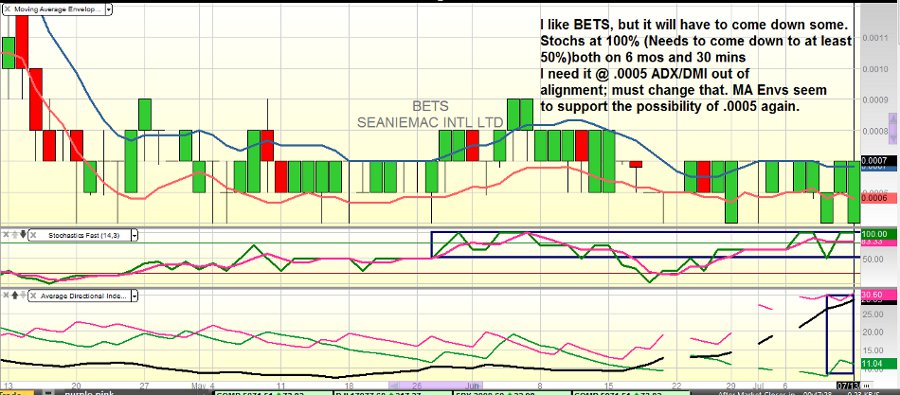
BETS; notes on chart.
GEGI, looks to have bottomed; hammer, today June 15.
'Kay Nasdaq2020, here she is:
ELTP 3 mos Chart:
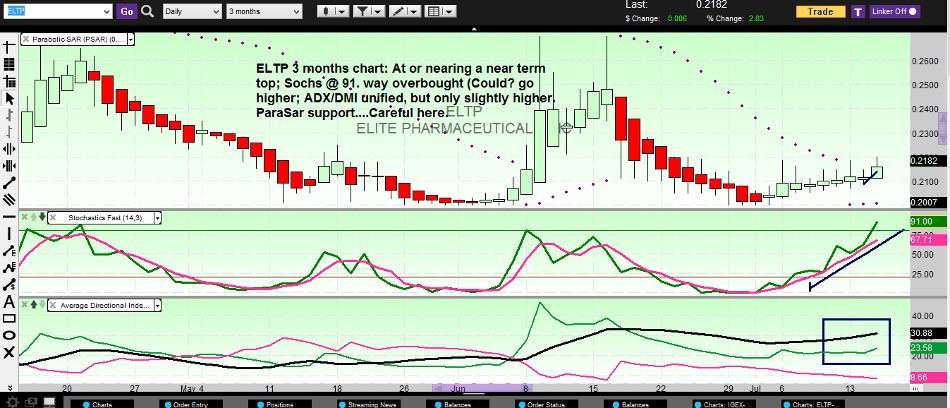
Notes: on chart, s/b 'Stochs', not 'sochs'. TY.
Click on image to enlarge chart.
Need a TA update over at ELTP. Thanx
Arnold, the usual: volume buyers; good news. Do you mean the indicators? I regularly use FStochs, ADX/DMI; MACD, Donchian Channels Watch them! and ParaSar. GL.
Nah, just wanted to confirm it, thanks!
BTW, for the chart to work what is needed?
Sharpei Diem!...You, too can learn to determine price direction without having to struggle through numerous online studies. |

'Keep It Simple Stupid' in the Complicated World of Stock Trading and Investment.
Thinking about where to best get in or out of your targeted stock? When you doubt where to put in a 'buy' order, go for the lower price even if means waiting -and you are chomping at the bit . Fibonacci numbers are most helpful as are technical indicators: moving averages, long term as well as short term chart assessments, Elliott Wave, rsi, macd, slow stochastics, adx/dmi, Donchian Channels, etc. in conjunction with Fundamentals to include the latest Q's, paying particular care to net assets.
(When considering small caps, I tend to pay particular attention to and avoid those that show reserves out of balance when compared to future requirements to operate, low floats, possible bk or 'lawsuits' mentioned on message boards and heavy finger-pointing at management found on message boards. (This last can be unreliable if there is an unusually high complement of postings of questionable or malicious intent.)
| Some believe technical analysis works, while others feel it's akin to reading tea leaves. Judging by the feedback comments on this column, reader opinions are sharply divided too. The fundamental analysts who didn't see the fall in the oil price, or who told us that gold was going back to $1,500, or that the DOW would collapse didn't seem to attract as much trenchant criticism as those of us involved in technical analysis. In 2014 we produced weekly CNBC blogs providing trading outlooks based on technical and chart analysis. We use chart analysis to establish the probability of trend change and to set price targets and objectives. In 88 percent of analysis notes in 2014 the price targets were achieved or exceeded. That's around the same percentage of correct calls in 2013 and 2012. The analysis methods we use are not complex; they can be applied by anyone without the need for a Master's degree in finance. These methods are covered in my books, including Guppy Trading. Charting analysis provides both the calculated price targets and the price levels that indicate the trade has failed. In 12 percent of cases, the analysis is not correct, but chart analysis provides exact price levels that signal this decision in real time. 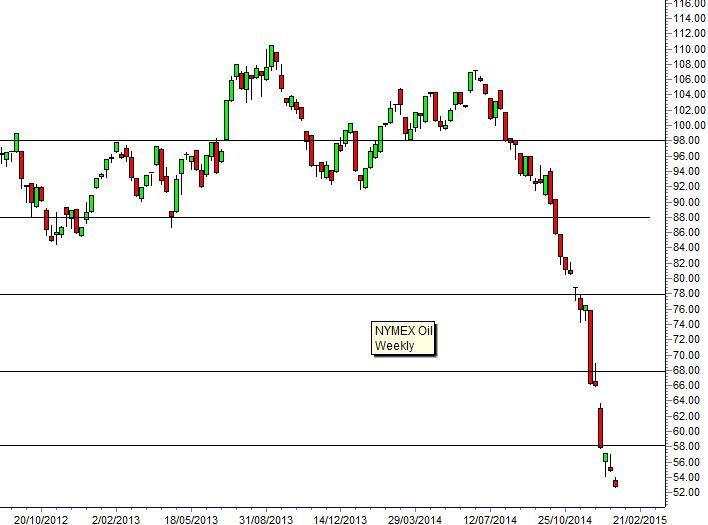 Our best calls for 2014 included the January 2013 DOW target of 17,000, NASDAQ at 4600 and S&P at 2000. They also included oil at $88, and then later $68 and $58. The next downside support target for NYMEX oil is $48. Gold support near $1,180 and the Shanghai Index upside targets above 3000 were also other correct analysis calls. Our worst call was the NIFTY where we expected the parabolic trend to develop into a 50 percent or greater retracement. There was a correction, but it was not a major change in the trend. Two bullish calls on the Australian dollar were also incorrect, with the market failing to break through resistance levels. Chart analysis is designed to identify situations where high probability outcomes are expected. Often chart analysis can be used to set exact price targets. The CNBC notes apply the same analysis methods we use in our personal trading and we use them because they work. Daryl Guppy Contributor This site is not intended to be a full course of study as there would be no time to process members' charts and questions, but there will be an attempt to encapsulate the oft-asked critical issues with TA as they apply to most of you. For more in depth study I have noted above under 'Author's Sources' and highlighted text quality sites that can be accessed online. (If you have a particular question regarding the action of an indicator or related to this process, just post it and I will answer to the best of my ability. Thanks for your patience with the limitations of this site. Using Technical Indicators The following is a short cut to finding an entry point but if you use most or all these 'tests' before jumping in, you should have some protection from overpaying a stock. (It is imperative that you use these in conjunction with the following time charts: Weekly one year, two year, five year, twenty (not all necessarily but use about three); AND. also do the same with the daily _ and even take a look at a couple of monthly charts (one to twenty years depending on how long its been listed, of course); then the final critical data to cement your decision should come from very short term - from six months daily to 60, 30, 10, 05 mins (in multiple time frames - two to 20 days, for example). Moving Averages: 50 DMA... Does this support a current price or are you looking forward to resistance at this MA? Same with 200 DMA. It's a happy chart that shows an upward cross over the 200 DMA by the 50. Use these in conjunction with the other Tech Indicators.
***Notice: I would like to welcome aboard one other chartist, Conix from the IHUB family of contributors. He, too will be adding his expertise in this area to those who wish help in their investment choices and approaches. Rules of Investing 1-10 are Keep It Simple Stupid X 10.  |
| Volume | |
| Day Range: | |
| Bid Price | |
| Ask Price | |
| Last Trade Time: |