 News
News  Market Data
  Discover
Support: 888-992-3836
Copyright © 2023 InvestorsHub Inc.


Register for free to join our community of investors and share your ideas. You will also get access to streaming quotes, interactive charts, trades, portfolio, live options flow and more tools.
My U.S. Business Sector ETF portfolio continues to do well over time. It's comprised of business sectors the same as the S&P 500 plus a Real Estate (REIT) ETF and a large cap growth ETF. The sector ETFs are invested in "Equal Weight" ETFs provided by Invesco. They give a greater exposure to small and mid cap stocks than do the S&P 500 cap weighted sector funds. All in all performance has been pretty good over the years.

ETFs are:
RSPC
RSPD
RSPF
RSPG
RSPH
RSPM
RSPN
RSPR
RSPS
RSPT
RSPU
XLG
Each sector fund is managed as a separate AIM engine with its own reserve of cash. Reasonable yields from these funds contribute to the cash reserves over time while AIM manages inventory through buying and selling incremental amounts of each position.
Best wishes,
OAG
Hi Toof, Re: Various ETF suppliers....................
The larger "index" based ETFs have generally a bit less amplitude in their price movements. That would probably include the i-Shares and SPDR products. That's the 'bad news.' The good news is they tend to be quite a bit less expensive to own on an annual expense ratio basis. Those index ETFs even as Sector ETFs are generally cap weighted since the indexes on which they are based are also.
The more specialized ETFs that follow the same business sectors will have a bit more amplitude for two reasons: 1) They probably don't have as many individual company stocks included. Typically there are only 50 to 75 companies in the more specialized sector funds such as 1st Trust's or PowerShares. 2) The more specialized sector ETFs are generally not cap weighted. This means things like AAPL (currently about 11% of the QQQ) don't distort performance either to the good or bad side in as great a degree.
These "filtered" ETFs generally are more expensive than the ones based on the big indexes. I did a spreadsheet some time ago of the 9 business sectors that are in the S&P 500. The sheet included SPDR, Vanguard, I-Shares, PowerShares, 1st Trust and Guggenheim (equal weight). I included some objective and subjective columns in the sheet. 52 week High/Low ratio was one with annual expense and other items. I graded each item from 1 to 4 for each sector and each supplier. It was quite extensive. The idea was that the highest number for each sector would show who had the best overall potential performance.
The result was, at the time, rather frustrating. No clear winner stood out. Each supplier has a couple of sectors that were best or second best in class. Each has some at the other end of the spectrum. I had hoped for a clear result but one never has materialized. It then becomes a preference on the individual's part.
I tend to like the sector funds with fewer companies and generally more equally weighted. They tend to give AIM a bit more with which to work. However, that also comes with a slightly higher annual cost burden.
Hi Tom
Any thoughts on weather Wisdomtree, I Shares, or SPDR sector S+P funds are better for Aiming (IE for instance has more volatility or other attributes that might make it better).
I am about to chart these against each other and will get back but maybe one has higher dividends on average or something else.
Toofuzzy
Here's a White Paper on Sector ETFs vs "Style" ETFs prepared by SPDR:
http://www.statestreetspdrs.com/1282/files/Staying%20a%20Step%20Ahead%20with%20Sector%20Investing.pdf
Sector ETFs........................
PROVIDER

  POWERSHARES:
  PEZ        CONS. DISCRETIONARY
  PFI        FINANCIALS
  PSL        CONS. STAPLES
  PRN        INDUSTRIALS
  PTF        INFO TECHNOLOGY
  PTH        HEALTHCARE
  PUI        UTILITIES
  PXI        ENERGY
  PYZ        BASIC MATERIALS

  SPDRS:
  XLY        CONS. DISCRETIONARY
  XLP        CONS. STAPLES
  XLE        ENERGY
  XLF        FINANCIALS
  XLV        HEALTHCARE
  XLI        INDUSTRIALS
  XLB        MATERIALS
  XLK        INFO TECHNOLOGY
  XLU        UTILITIES

  1ST TRUST:
  FXD        CONS. DISCRETIONARY
  FXG        CONS. STAPLES
  FXH        HEALCARE
  FXL        INFO TECHNOLOGY
  FXN        ENERGY
  FXO        FINANCIALS
  FXR        INDUSTRIALS
  FXU        UTILITIES
  FXZ        BASIC MATERIALS

 US DOMESTIC EQUAL WEIGHT ETFS
  GUGGENHEIM:
  RCD        CONS. DISCRETIONARY
  RGI        INDUSTRIALS
  RHS        STAPLES
  RTM        MATERIALS
  RYE        ENERGY
  RYF        FINANCIALS
  RYH        HEALTHCARE
  RYT        INFO TECHNOLOGY
  RYU        UTILITIES

  INTERNATIONAL SECTOR ETFS
  SPDR:
  IPD        CONS. DISCRETIONARY
  IPF        FINANCIALS
  IPK        INFO TECHNOLOGY
  IPN        INDUSTRIALS
  IPS        CONSUMER STAPLES
  IPU        UTILITIES
  IPW        ENERGY
  IRV        BASIC MATERIALS
  IRY        HEALTHCARE

 iShares Dow Jones U.S. Consumer Index Fund ETF	                IYC
  iShares Dow Jones U.S. Energy Sector Fund ETF	                IYE
  iShares Dow Jones U.S. Financial Sector Index Fund ETF	        IYF
  iShares Dow Jones U.S. Financial Services Index Fund ETF	IYG
  iShares Dow Jones U.S. Health Care Index Fund ETF	        IYH
  iShares Dow Jones U.S. Industrial Sector Index Fund ETF        IYJ
  iShares Dow Jones U.S. Consumer Goods Index Fund ETF	        IYK
  iShares Dow Jones U.S. Basic Materials Index ETF	        IYM
  iShares Dow Jones U.S. Real Estate Index Fund ETF	        IYR
  iShares Dow Jones U.S. Technology Index Fund ETF	        IYW
  iShares Dow Jones U.S. Telecommunications Index Fund ETF	IYZ

  PowerShares S&P SmallCap Consumer Staples Portfolio ETF        PSCC
  PowerShares S&P SmallCap Consumer Discretionary Portfolio ETF	PSCD
  PowerShares S&P SmallCap Energy Portfolio ETF	                PSCE
  PowerShares S&P SmallCap Financials Portfolio ETF	        PSCF
  PowerShares S&P SmallCap Health Care Portfolio ETF	        PSCH
  PowerShares S&P SmallCap Industrials Portfolio ETF	        PSCI
  PowerShares S&P SmallCap Materials Portfolio ETF	        PSCM
  PowerShares S&P SmallCap Info Tech ETF	                        PSCT
  PowerShares S&P SmallCap Utilities Portfolio ETF	        PSCU

  ProShares Ultra Basic Materials ETF	   UYM
  ProShares Ultra Consumer Goods ETF	   UGE
  ProShares Ultra Consumer Services ETF	   UCC
  ProShares Ultra Financials ETF	           UYG
  ProShares Ultra Health Care ETF           RXL
  ProShares Ultra Industrials ETF           UXI
  ProShares Ultra Oil & Gas ETF	           DIG
  ProShares Ultra Real Estate ETF           URE
  ProShares Ultra Technology ETF	           ROM
  ProShares Ultra Telecommunications ETF	   LTL
  ProShares Ultra Utilities ETF	           UPW
Hi Toof, One has about 10 different ETFs and the other has about 20.
Both use govt, corporate and REIT components.
Best regards,
>>>Two different portfolio strategies. Hence two different holdings.<<<
What is the difference? They both invest in high yield corporate bonds.
I had a sale today of 20% of my WRI @ $34.051 (bought at $10 and $13)
Toofuzzy
Hi Toof, Re: Why own both............
Two different portfolio strategies. Hence two different holdings.
Best regards, Tom
Hi Tom
In looking at a chart of HYG and JNK on Yahoo Finance they seem to track very closely, especially for any period of a year or less. HYG does a little better over the long term.
Why bother to own both?
Toofuzzy
Hi Toof, I'll capture some histograms on Monday and post. I don't have a lot of history on JNK, however,
Best regards,
Thanks Tom
So I guess you can AIM one against the other >grin<
Toofuzzy
Hi Toof, RE: Corp Income ETFs................
I don't really have a good opinion on this - I happen to own both, so there's one solution!
Best regards,
HYG or JNK
Not the best fixed income components as they both tend to move with stocks but better than TLT at the present time which I think will crash and burn when interest rates rise.
Of the two (HYG, JNK) anyone have any thoughts why one is better than the other. I am leaning towards HYG
Toofuzzy
Update: All ETFs aren't created Equal..................
In 2011 when I first wrote about this idea 5 full years of data weren't yet available on all the components. Here's the data as of MorningStar's review today:
Emerging Markets ETFs
Category                     EEM        DEM        VWO       PXH
 52 Week Hi/Low Ratio        1.24       1.21       1.22      1.27
 Annual Expense Ratio        0.69%      0.63%      0.20%     0.49%
 Dividend (TTM)              1.69%      3.31%      2.19%     2.08%
 12 Month Price Performance +1.32%     -0.04%     +1.68%    -3.12%
Category                     EEM        DEM        VWO       PXH     E.M. Category
 Upside 1 Year Capture      74.79      60.15      76.36     75.92        77.93
 Downside 1 Year           110.39      83.05     109.25    135.76       103.99
 Up/Down Ratio              0.68       0.72       0.69      0.56          0.75
 ------------------------------------------------------------------
 Upside 3 Year Capture      93.73      85.44      94.09     94.49        86.21
 Downside 3 Year            92.93      70.59      90.73    102.73        82.36
 Up/Down Ratio              1.01       1.21       1.04      0.92          1.05
 ------------------------------------------------------------------
 Upside 5 Year Capture     118.94     107.31     117.92    123.94       109.70
 Downside 5 Year           110.91      84.03     110.20    115.26       102.42
 Up/Down Ratio              1.07       1.27       1.07      1.08          1.07
 ------------------------------------------------------------------
In 2011
 ETF Rank        52 Week Hi/Low   Annual Expense  Dividend    Performance   3 Year Up/Down Ratio
 EEM                   2               3              3            1                  3
 DEM                   4               2              1            3                  1
 VWO                   3               1              4            2                  2
 PXH                   1               4              2            4                  4
 --------------------------------------------------------------------------------------
 Thru 2012
 EEM                   2               4              4            2                  3
 DEM                   4               3              1            3                  1
 VWO                   3               1              3            1                  2
 PXH                   1               2              2            4                  4
Long thread about the UBHS Tom that you might find to be of interest (I haven't read it myself, just found it and thought of you).
http://www.bogleheads.org/forum/viewtopic.php?t=38374
Regards. Clive.
Hi Tom
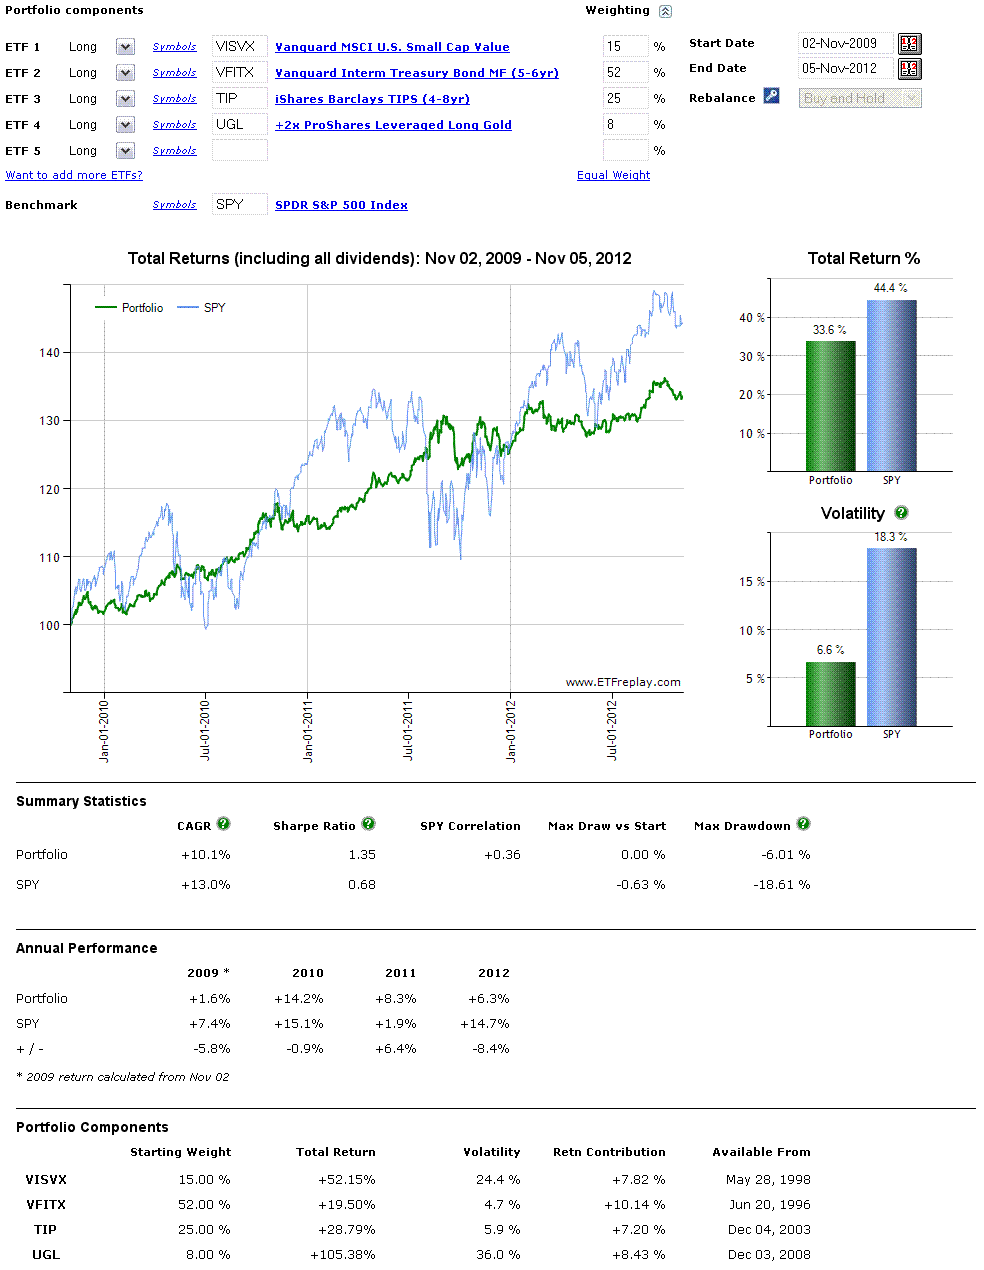
For no particular reason other than its very quiet here, looking at a Taleb 15% speculative, 85% safe type asset allocation over a similar time period to that chart you posted, overlaid with another similar allocation that goes back a bit further in time (leveraged ETF history is limited so I had to use non leveraged versions)
Concept being around 7.5% in 2x Small Cap Value (UVT) and 7.5% in 2x Gold, with the remainder in bonds (TIP and 5 year Treasury). But etfreplay doesn't have data for UVT, so these snapshots are proxies (there's not much difference between these and the UVT/UGL versions).
Animated GIF (press the ESC key to halt the animation, you'll have to reload the image to get it running again)
Best regards.
Clive.
Hi Tom
My account has recovered nicely since 2008 or so but hasn't done much over the last few months.
The example is not what i own but what I would like to move towards.
Toofuzzy
Hi Toof, Re: Diversification by "Style".......................
My retirement account is a 'style diversified' portfolio along the lines of what you are suggesting. I've had all the components in place since late in 2007 but not properly balanced until around the beginning of 2009. The idea of the portfolio initially came from the "Ultimate Buy/Hold Strategy" suggested here. I modified it slightly, but generally kept to the guidelines shown.
Here's what the last three years of this portfolio's activity look like in composite form:
This portfolio was completely tapped out of cash for a while in late 2008 and early 2009, but as you see here, it is now sporting a healthy reserve of about 25% of total value.
Just today we sold 5% of the International Small Cap Dividend component (DLS from Wisdomtree). Those shares had been purchased in the buying frenzy of November, 2011. The LIFO return on the round trip was in excess of 18% net. Not bad in a generally flat year!
Also recently I sold some Pacific Rim, ex-Japan (I-Shares - EPP) for a similar gain in another portfolio. So, in spite of what we've been seeing on CNBC, there are some areas for profitable ETF trading even as the "bad news" continues to inundate viewers.
Thanks for getting some activity started here again.
Best regards,
Risk and Diversification
1) The main risk of AIMing individual stocks is that they can go to zero. Even big companies can go bankrupt.
2) Diversifying your holdings are important.
3) You need more diversification than an individual fund will give you.
4) There are two main ways to diversify STYLE (large, small, value, fixed income) and INDUSTRY ( financial, materials, consumer, utilities, medical, etc) Style requires fewer funds.
5) There is a third thing that you can use to diversify and that is time. When you are young and with limited funds, you can decide what you want to own in your account (maybe large value, small value, foreign, REIT, and bonds) and buy one of the funds each year (whichever has done the worst over the past year that you still do not own)
So below I put together a basic portfolio that can be added to over time. You can AIM each fund or you can decide what percentage of each you want to own and rebalance at most once/year (what I call SLOW AIM) Either will work.
IVE large value
IWN small value
EFA foreign
ICF REIT (real estate investment trusts)
TLT bond
To that can be added if you want
Instead of EFA
PIN or EPI INDIA
FXI CHINA
EWZ BRAZIL
EWA Australia
RGLD Gold (an individual stock)
SLW Silver (an individual stock)
SCCO Copper (an individual stock)
IYE Oil
WY Timber (an individual stock) or CUT
IYZ Telocom
IDU Utilities
IBB Biotechnology/medical
RAIL (not sure what to use)
For bonds till interest rates peak again I would use SHY instead of TLT
........................................................
Any body have any thoughts on the above?
In some ways I feel I am fighting the last battle with the gold, silver, copper, oil, and timber. I also feel like I am adding more complications than needed by adding to the basic portfolio.
Toofuzzy
I have been thinking about this post for awhile now.
1) The main risk of AIMing individual stocks is that they can go to zero. Even big companies can go bankrupt.
2) Diversifying your holdings are important.
3) You need more diversification than an individual fund will give you.
4) There are two main ways to diversify STYLE (large, small, value, fixed income) and INDUSTRY ( financial, materials, consumer, utilities, medical, etc) Style requires fewer funds.
5) There is a third thing that you can use to diversify and that is time. When you are young and with limited funds, you can decide what you want to own in your account (maybe large value, small value, foreign, REIT, and bonds) and buy one of the funds each year (whichever has done the worst over the past year that you still do not own)
So below I put together a basic portfolio that can be added to over time. You can AIM each fund or you can decide what percentage of each you want to own and rebalance at most once/year (what I call SLOW AIM) Either will work.
IVE large value
IWN small value
EFA foreign
ICF REIT (real estate investment trusts)
TLT bond
To that can be added if you want
Instead of EFA
PIN or EPI INDIA
FXI CHINA
EWZ BRAZIL
EWA Australia
RGLD Gold (an individual stock)
SLW Silver (an individual stock)
SCCO Copper (an individual stock)
IYE Oil
WY Timber (an individual stock) or CUT
IYZ Telocom
IDU Utilities
IBB Biotechnology/medical
RAIL (not sure what to use)
For bonds till interest rates peak again I would use SHY instead of TLT
........................................................
Any body have any thoughts on the above?
In some ways I feel I am fighting the last battle with the gold, silver, copper, oil, and timber. I also feel like I am adding more complications than needed by adding to the basic portfolio.
Toofuzzy
Well after doing some considerable nail biting I bought back my expiring
SLW JAN 12 $35 PUTS for $3.35 and
SOLD SLW JAN 13 $30 PUTS for $5.30
I was hoping they would expire worthless but got nervous this morning as I saw SLW open on a big price rise but then sink
Toofuzzy
Re: All ETFs aren't created Equal..................
Not all ETFs are created equal, especially in a specific category in which we're interested. Sometimes we look at how something will work with AIM's volatility capture. Sometimes at annual expense ratio (hidden cost to us as owners of the ETF). Sometimes we look at the dividend being paid out to us. Finally sometimes we are looking at who's done the best recently.
From a "total return" point of view we might get different answers about what is "best" in a certain category. Here's an example:
Emerging Market ETFs
Category                EEM      DEM      VWO      PXH
 52 week Hi/Low Ratio  1.51     1.41     1.49     1.52
 Annual Expense Ratio  0.67     0.63     0.22     0.85
 Dividend (TTM)        2.05%    4.97%    1.95%    2.62%
 YTD Performance     -13.47%  -17.60%  -13.74%  -26.01%
Category              EEM      DEM      VWO      PXH   EM Index
 Upside 1 Yr Capture 72.87    71.46    75.89    76.71    53.83
 Downside 1 Yr       96.13    76.33    98.58   103.33    86.78
 Up/Down Ratio       0.758    0.936    0.770    0.742    0.620
 -------------------------------------------------------------
 Upside 3 Yr        122.61   113.39   122.20   127.13   108.12
 Downside 3 Yr      100.42    81.20    93.75   106.65    83.63
 Up/Down Ratio       1.221    1.396    1.303    1.192    1.293
 -------------------------------------------------------------
 Upside 5 Yr        137.63     n/a    137.49    n/a     128.24
 Downside 5 Yr      109.04     n/a    107.92    n/a     100.42
 Up/Down Ratio       1.262     n/a     1.274    n/a      1.277
ETFs have now been around and widely available for a decade. Still, it appears there is much confusion about the generic lable of "ETF" as newer, non "index" products have come to market in recent times. Here's an article on hearings about the subject:
http://www.marketwatch.com/story/some-advisers-dont-understand-etfs-managers-2011-10-24
Best regards, Tom
Hi Karw
Thanks for the info about share lending.I guess that is the incentive to run an ETF. Synthetic ETFs or any ETF that uses futures to replicate the holdings of an index, I agree are best avoided if another choice is available. Usually futures contracts are used with the commodity ETFs and some foreign ones (China and India come to mind)
I thought VGK was a fund and was looking for Vanguards ETF equivalent. Didn't realize it was an ETF. Europe is having all kinds of issues so I imagine this fund and the stocks it holds are depressed right now. Whether that is a bargain or not will depend on the companies future earnings which will also effect the fund yield.
>>>>>
VEA is europe/pacific(MSCI EAFE) while VGK(MSCI Europe) is europe only. I could not find the VEA yield on the vanguard website.
At this moment i see two problems with ETFS:
1- synthetic ETFS(use of futures). AVOID THEM.
In 2008 I remember that commodity ETFs which were dependent on AIG did not trade for a week or so, until Paulson did his thing.
At this moment I would avoid any synthetic ETFs, like DBC. Also in France and Germany there are quit a number of synthetic ETFs at the moment that will get into problems when the banks blow up(after a Greece event or an Italian event) <<<<
Toofuzzy
Hi toofuzzy,
VEA is europe/pacific(MSCI EAFE) while VGK(MSCI Europe) is europe only. I could not find the VEA yield on the vanguard website.
At this moment i see two problems with ETFS:
1- synthetic ETFS(use of futures). AVOID THEM.
In 2008 I remember that commodity ETFs which were dependent on AIG did not trade for a week or so, until Paulson did his thing.
At this moment I would avoid any synthetic ETFs, like DBC. Also in France and Germany there are quit a number of synthetic ETFs at the moment that will get into problems when the banks blow up(after a Greece event or an Italian event)
This weekend there was a warning here by the Society of Equity Investors to get out of these ETFs!
2- Lending failures.
I know of 2 lending failures now:
There was the case of a DBX Europe tracker that suddenly was invested in Japan smallcap.
The other is the AMUNDI(Credit Agricole/Socgen) MSCI Netherlands ETF, which contains 95% Swedish equities. I can assure you that Sweden is not part of the Netherlands!
These are the things I know from my own experience. There will be more issues that we do not know yet. Vanguard is the only company that will return the lending profits to the ETF. Other companies will take 50% of those profits. The investors have the risk, the ETF supplier the profit.
What to do? :
1- I will always take a Vanguard ETF when I have the choice.
2- Look for opportunities elsewhere(CEF for example)
3- Maybe forget about ETFs and create a Graham like portfolio of stocks. (I discovered this holiday that Graham was kind of an AIMer before Lichello published his book)
Best Regards,K
Hi Karw
Vanguard also has an ETF that matches VGK (VEA)
I wonder how that compares
Toofuzzy
Hi K, Re: ETFs and who's profiting........
Thanks for the notes on those three ETFs. That's an interesting point of view.
Some Closed End Funds charge higher annual fees, but not all. Maybe we should sort ETFs against similar CEFs to see what the long term performance difference might be.
Thanks,
Tom
Hi Tom,
I noticed the following:
 IMEU MSCI Europe        Div%: 3,5%                ER: 0,35%        (europe based)
 IEV  S&P Europe 350     Div%: 3%                  ER: 0,60%        (US based)

 VGK  MSCI Europe        Div%: 5,3%                ER: 0,14%        (US based)
This article sounds scarier than the reality of using most ETFs, but does point out the fact that there are so many new ones that are a far cry from the original idea of "index" funds traded daily.
http://www.advisorperspectives.com/newsletters11/The_Risks_of_Exchange-Traded_Products.php
I've gone back to look at many of my own ETFs to see if short selling is allowed, for instance. Most do allow it. Some allow options to be traded, too.
Many of the new products are drifting further and further from the original "index" ideal. All I need are the main business sectors in equal weight format filtered for value or growth and I'm content.
Any further thoughts?
Best regards, Tom
Reviewing your ETF holdings for Upside and Downside Capture Ratio.......
A true index fund should, in theory, capture exactly the upside and downside of the index exactly. However, today in the world of ETFs we find many semi-active managed funds available. These are a little harder to benchmark than pure index ETFs and funds. How much is that extra layer of management worth to us?
I note that MorningStar how has Up and Down capture ratios listed in their Ratings and Risk heading for exchange traded funds. ( http://performance.morningstar.com/funds/etf/ratings-risk.action?t=FVL®ion=USA&culture=en-US ) Looking at PYH and FVL for the last year and three years shows FVL having a better set of numbers:
Fund                Upside Capture Ratio
                  1 Yr            3 Yr            5 Yr
 FVL             134.09          101.36           99.64
 PYH              87.40           84.59            N/A

                    Downside Capture Ratio
 FVL             101.32          112.59          116.13
 PYH             105.63          119.37            N/A
Hi Lisa, Re: FVL and history with the Value Line based ETFs.....
While I've only had FVL since last July (after PowerShares changed from Value Line's index) I'd owned the PHY (Timely stocks in timely industries from Value Line) for a few of years before that.

I own this ETF in my retirement account as one of ten positions in that portfolio. It did okay coming out of the 2009 lows, but didn't do as well as Small and Mid Cap Value type holdings. 2010 turned out to be a very good year for it, especially after August. Through most of 2010 it outperformed many of the small and mid cap value funds. I think the lag is due to the Value Line #1 Timely stocks being somewhat more of the "growth" nature and growth was out of favor for a year after 2009 lows.
As you can see by the trading, it does move around enough for it to be interesting for AIMers. It has an annual cost of around $0.70/$100, so it's not the cheapest index fund around. However, Value Line takes a cut of that, too, for their index license and name rights.
The FVL ETF follows the 100 stocks ranked by Value Line as #1 in Timeliness for ownership and freshens their inventory of stocks once a quarter. So, in general it will be following the group #1 stocks as seen in this graphic from Value Line:

This shows the 2010 returns for Group 1 when re-structured once a quarter for rank changes:

The results compare favorably to FVL's 2010 gain of about 28.3% for the year. So, quarterly reconstitution doesn't seem to hurt the performance. Weekly reconstitution doesn't improve things much as the #1 Timely stocks list doesn't change very quickly.
Because Timeliness #1 Stocks tend to be "momentum" driven, they can take a serious wallop when markets turn ugly. Therefore, AIM with a healthy cash reserve is a great management tool. It's nice to think we'll be participating in a near 14% per annum average gain on the invested side and then adding value with AIMing on top of that over many cycles.
I hope your investing continues to do well.
Best regards,
Tom
Nice analysis, Tom!
Two to keep tabs on.
Re: PYH vs FVL................
Last year PowerShares changed their PYH ETF from using Value Line's "Timely stocks in Timely industries" to another base index. I'm not certain of the reasoning, but since I'd selected PYH as a proxy for Value Line's Timeliness rankings, the change meant I had also to change my holding.
First Trust's FVL had been around slightly longer than PYH and also uses Value Line's top 100 most timely stocks. This is slightly different from the PYH basis, but was far closer than the modified PowerShares version. So, FVL became my choice.
After the change became effective (end of June, 2010) I decided to periodically track progress between the two funds. Here's the latest snapshot from July 1st to date.

While the PYH ETF has continued to rise, it is now looking more like an "all cap value" fund. FVL, for this short history, has been able to outdistance the PYH etf by a considerable amount.
It pays us to review our ETFs periodically to assure ourselves that they have not changed their basis of structure and that they still fit in our overall portfolios where we initially had them slated.
Best regards,
Tom
Hi Doug, Re: SPY back testing......................
Thanks for the summary of the SPY holding being AIM'd for the long time frame shown in your example. For most people, a decade is a very long time to wait for gratification, so showing what patience adds to one's value is a good thing.
Appreciatively,
Tom
Just updated the back-test through 12/2010. Here is the link:
http://hubpages.com/hub/robertlichelloAIMSystem
Your feedback is greatly appreciated!
Thanks, Doug
Sorry message posted to wrong thread.
Larry G
I have been giving a lot of thought to this deep-diver dilemma which has basically kept me out of the market because 2008-2009 scared me to the bone. I have read all the posts about a stop loss level and ladders but none of them make me warm and fuzzy (don't even go there Toofuzzy). Here is my what if. Let's say we use the stop loss (10 month, 200 day or whatever makes us comfortable) and we make no real buys on the way down under that stop loss level. But some will say we are loosing buying opportunities so we make virtual buys on the left side of the V curve but we turn them into real buys on the left (up) side of the V curve at the same exact price using GTC orders or buy stop orders or whatever you call them. That way we are getting the same buy but we are in a uptrend and hopefully that up trend will continue and if it doesn't we stop buying until the uptrend continues and buy again on the right side of the curve when we get to the next buy level. Now I am sure it isn't as simple as that because we are entering the buys on the down left side of the curve but they are actually virtual and when we actually do make these buys on the up cycle on the right up side of the curve I don't know how the software well handle that and I don't care as long as I am comfortable with knowing where the bottom finally came. I know it could be a double bottom or triple bottom but I would still feel better. Just food for thought.
Larry G
Hi Lisa, Re: CHY....................
It's still one of my core holdings in my retirement account. I'm glad I could average down during the Big Slide in '08 and '09 and then bank some cash when it rebounded. THe distributions still make me smile. Current yield is around 8.5% which beats money market funds nicely!!!
Best regards, TV
Hi Tom,
Thanks for the info and review!
BTW: How's ol' CHY looking for you? I'm still in and profitable.
PYH - Powershares Value Line Timely Stocks in Timely Industries.....
This ETF by PowerShares is changing its basis for indexing. The new fund, still PYH, will be called the MorningStar StockInvestor Core Portfolio and be indexed to a MorningStar index of the same name.
"The Fund will normally invest at least 90% of its total assets in common stocks that comprise the Index. The Index is comprised of approximately 50 stocks of high-quality companies selected by Morningstar. The Index is reconstituted and rebalanced quarterly using the methodology described above."
--------------------------------------------------------------
I've used PYH in my IRA as a central part of the equity side of that account. I did so because of the high volatility of the Value Line Timely Stocks and their "momentum" character. This change creates overlap with several other positions in my IRA, so I've sold the PYH and have replaced it with First Trust's Value Line 100 ETF, symbol FVL.
FVL has a bit higher annual expense ratio, but also has slightly higher BETA, which should help compensate.
Best regards, Tom
OT when a company issues more shares
Many times a company does what I think are stupid things like buying back stock when it is near its high or selling more stock near its low ..... why ... how is it rational.
NLY (a mortgage REIT) is issuing 50 MILLION new shares towards its high price which makes sense BUT it has a 15% dividend yield!
So shouldn't they be able to borrow money cheaper than the dividend payout?????
My thought is if they are selling the stock they do not believe it is worth more than they are selling it for now.
If they use the new money to reduce leverage the dividend goes down. If they leverage back up and rates go against them (short rates climb) guess what ...... dividends go down! I don't know how this helps the company.
Very
Toofuzzy
Another on ETF's and retirement asset allocation
http://seekingalpha.com/article/210314-etf-asset-allocation-for-smart-401ks?source=email
Good article on asset allocation
http://seekingalpha.com/article/213562-asset-allocation-investing-with-styles-can-pay-off
Toofuzzy
Tom,
ETF setups for retirement and investment accts. Here is a link to another artical. http://www.myplaniq.com/LTISystem/UserFiles/tutorial.pdf
Been many years since I last visited/posted. Good to see that you are still going strong. Visited you home page. Couldn't quite figure out your "good bye" message on your newsletter page. Comforting to see you still active here.
Thanks Tom
I remember starting out with ETF's when switching from funds trying to decide whether to go with "style" or "industry" diversification.
Toofuzzy
Hi Toof, Re: Structure of retirement account.........
1) There were two reasons why I changed from Industry to Style. The first one is that there wasn't enough "criticl mass" to get the level of diversification I desired for the account in sector funds. To get that diversification I would have needed probably 13 to 18 separate ETFs/CEFs which would have subdivided the Pizza into too many slices.
The second was the reading of the Ultimate Buy/Hold Strategy article. I liked its simplicity and diversification. I also thought that any Buy/Hold strategy worth its weight would probably benefit from the use of Lichello's plan. My thought was that it would be an interesting experiment to see if AIM could enhance UBHS over time and cycles.
I started the restructuring in the later part of 2007 but never got it completed before the income side of the account headed downward. Therefore, I had purchased all the new pieces, but not sold enough of the income side to fully fund proper cash reserves for the new slices. So, for the first year it was very close to UBHS in that it was under funded with cash.
2) I originally purchased EEM but switched to DEM; purchased IJS but switched to DES; bought IJJ but switched to DON; bought EFV but changed to DTH; and last, bought NRO but changed to VNQ. Most of these changes occurred in January of 2009 when I finally completed the proper balancing of the account closer to the UBHS.
There's now ten pieces plus cash. I'm contemplating one more change should the opportunity present itself. I'm not exactly sure how it will work. More on that later.
Best regards,
Tom
Tom RE IRA Portfolio
1) Why did you decide to switch from INDUSTRY to STYLE
You could have kept IYE IBB IYG IYW and CHY/ACG and added 3 foreign funds (large value , small value, emerging market) and a metals fund and a REIT fund ( I thought you owned one already)
2) Why did you decide to go with Wisdomtree for most of your funds instead of I-shares which I think has cheaper fees and similar returns
IVE for large value
IWN for small value
ICF REIT
EFA for Foreign large cap
I may eventually simplify my own portfolio to
IVE large value
IWN small value
EFA foreign (and maybe China, Brazil, India, Austrailia funds)
ICF REIT
SHY / TLT US bond (depending on interest rate curve TLT when rates invert)
SCCO Southern Copper Company
Toofuzzy
Capitalization weighted or equal weighted?
Tofuzzy
Most portfolios that use indexing will have a fund or exchange-traded fund that tracks the S&P Index. In fact, the S&P 500 has put together a strong move since March, but not all the stocks in the index have performed as well. During a downturn, it tends to be the smaller companies that lead the way out of the darkness, and that is proving true again. The largest companies, the mega caps, have actually lagged as a group.
While there are 500 companies in the Index, it gives much greater representation to the largest of the large-capitalization companies, so they influence its performance the most. The largest 50 companies currently represent 52.0% of the S&P 500’s performance. However, when the 500 companies in the Index are put on the same footing, we get a different view of the S&P 500.
The S&P 500 Equal Weighted Index, which gives all 500 companies equal representation and doesn’t favor the mega cap stocks, has significantly outperformed since the mid-March low, rising 50.2% at close last Friday, versus a gain of 34.0% that day for the S&P 500.
The contrast in performance doesn’t stop there, however. The Equal Weighted Index has outperformed for more than 10 years! It has risen 31.0% since 1998 while the S&P 500 has declined 7.0%.
Granted, even though these indexes include the same stocks, they are totally different animals. They have different earnings growth characteristics, price-to-earnings ratios, levels of volatility, and risk profiles. Typically, the Equal Weighted Index tends to be higher in all of these measures.
In the current environment when the stock market is trading in anticipation of an economic recovery, the S&P 500 Equal Weighted Index will continue to get more traction in the near- and mid-term. For investors who would like to track the S&P 500 Equal Weighted Index, there is an exchange-traded fund that attempts to mimic its performance: the Rydex S&P Equal Weight ETF (ticker symbol RSP).
Check it out for yourself. Compare RSP to SPY, which tracks the regular S&P Index. (You can compare the charts on the Yahoo Finance page.) The contrast is stark!
June 1, 2009 • 12:13 PM
From www.womenwithportfolio.com
Exchange Traded Funds
I want to write a post to the AIM ETF board to make sense of the various providers and how they compare and overlap. I wanted to cover the series that cover the market without overlap of holdings and leave out the leveraged 2 and 3x funds etc. I may do bonds in the future. I would like to explain what indexes they are based on in a rational matter. I wanted to cover the funds that are broken down into the 9 or 10 industry sectors. This list is probably not complete. There are also many more funds that cover various sub-sectors.
Some of these funds have more volatility than you might want for a taxable fund. Check Yahoo finance (Profile) Look in the lower right corner of the page.
Toofuzzy
There are a few S+P funds
SPY, IVV, RSP (equal weight) and VV from Vanguard is almost a S+P 500 fund along with FEX from FIRST TRUST
There are a few fund companies that divide the S+P 500 in to 9 or 10 sectors
The sectors in general order are:
Consumer discretionary, Consumer staples, Energy, Financial, Health, Industrial, Materials, Technology, (Sometimes Telocom), and Utilities. Sometimes there are REIT funds which would have a bit overlap.
SPDR INDEX
xly, xlp, xle, xlf, xlv, xli, xlb, xlk, xlu in addition there are some other "X" series funds
xme, xrt, xes, xsd, xop, xhb (which must have some overlap with the above)
www.sectorspdr.com
Fees are .22%
Together, the nine Select Sector SPDRs represent the S&P 500 as a whole. They are capitalization weighted.
VANGUARD ETFs
vcr, vdc, vde, vfh, vht, vis, vaw, vgt, vox, vpu, and vnq (REIT)
www.vanguard.com
Fees are generally .2%
The fund employs an indexing approach to track the performance of the MSCI U.S. Investable Market index. (total US market) It is market capitalization weighted.
RYDEX Equal Weight
rcd, rhs, rye, ryf, ryh, rgi, rtm, ryt, ryu
www.rydex-sgi.com
Fees are .5%
The investment seeks to replicate, before fees and expenses, the performance of the S&P Equal Weight index.
FIRST TRUST (QUANT)
fxd, fxg, fxn, fxo, fxh, fxr, fxz, fxl, fxu
Fees are .7%
www.ftportfolios.com
The index is a modified equal-dollar weighted index selects stocks from the Russell 1000 index that may generate positive alpha relative to traditional passive style indices through the use of the AlphaDEX(TM) screening methodology.
POWERSHARES QUANT funds
pez, psl, pxi, pfi, pth, prn, pyz, ptf, pte, pui
in addition they have pkb, pxe, pic, pxj, pmr, pjb, ptj (which must have some overlap in holdings with the above)
www.invescopowershares.co
Fees are aprox. .65%
The Dynamic Intellidex indexes evaluate companies based on a variety of investment merit criteria, including fundamental growth, stock valuation, investment timeliness and risk factors. Securities shown to possess the greatest capital appreciation potential are selected for inclusion in the index.
In addition I-Shares has DOW based INDUSTRY FUNDS
iym, iyc, iyk, iye, iyf or iyg, iyh, iyj, iyw, iyz, idu, and IYR or ICF (REITS) in addition there are
ibb, ieo, iez, ihe, ihf, ihi, iai, iak, iat, ita, itb ( which must have some overlap in holdings with the above)
www.ishares.com
Fees are aprox. .48% for the main sectors
The investment seeks investment results that correspond generally to the price and yield performance, before fees and expenses, of the Dow Jones U.S. Consumer Goods Index. (which is broader than the S+P 500) It is capitalization weighted
The foreign funds broken down in to the matching 9 sectors are:
SPDR S+P GLOBAL INDEX (ex-US)
ipd, ips, ipw, ipf, iry, ipn, irv, ipk, ist, ipu, and rwx (REIT)
www.spdrs.com
Fees are .5%
The investment seeks to replicate, net of expenses, the S&P/Citigroup BMI World ex-US Sector Indexes.
I-SHARES S+P GLOBAL (includes US companies)
rxi, kxi, ixc, ixg, ixj, exi, mxi, ixn, ixp, jxi
www.ishares.com
Fees are .48%
The investment seeks results that correspond to the price and yield performance, before fees and expenses, of the S&P Global Sector Indexes.
WISDOM TREE INTERNATIONAL (QUANT ex-US )
dpc, dpn, dka, drf, dbr, ddi, dbn, dbt, dgg, dbu, and drw (REIT)
www.wisdomtree.com
Fees are .58%
This fund series pays particularly high dividends because it is dividend weighted. That might be dangerous if an industry like banking has high dividends just before they go down the tubes.
The investment seeks to track the price and yield performance, before fees and expenses, of the WisdomTree International Sector indexes. The fund uses a representative sampling strategy. The index measures the performance of companies in developed markets outside of the U.S. that pay regular cash dividends on shares of common stock. Companies are weighted in the index based on regular cash dividends paid.
Hi Tom RE Wisdomtree Funds
Are any significant amount of their dividends a "Return of capital" or from trading profits? as opposed from earnings?
Toofuzzy
The advent of Exchange Traded Funds (ETFs) has brought a new way to use AIM on various Market Sectors. They offer an easy way to own and trade entire sector indexes without the expense and inconvenience of the typical open end mutual fund. Closed End ETFs (CEFs) offer yet another interesting alternative and some extra BETA because of their Premium/Discount range.
With AIM, we like to make our trades when the price/per share meets our requirements. With traditional mutual funds we never know exactly what the end of the day will bring - but that's what the basis of our our trade price will be. Using ETFs we can use "Good 'til Cancelled" Limit Orders to trade when our price is met, or trade any time during the day at the current bid/ask prices.
Diversified mutual funds usually don't have the ingredients that AIM likes - Frequency and Amplitude of price change. This is because their money is spread over many different business sectors of the economy all moving in their own directions. Individual sector funds look as though they will give us many more opportunities to capture volatility than do traditional diversified mutual funds. As this graphic shows, individual sectors perform well at different times in the economic and market cycles.

ETFs can be selected from a wide variety of industrial sectors, individual country funds and also from "value" or "growth" by size of capitalization. This offers us the chance to build a portfolio of our own that is easily as diversified as any mutual fund. If we use ETFs we preserve much of the frequency and amplitude of each sector that AIM uses for creating trading profits. Each sector seeks its own level while AIM adjusts properly for the changes. Overall the portfolio benefits from extensive diversification while also improving AIM trade related returns.
An interesting article on building the "ultimate buy-and-hold" portfolio can be read at:
http://www.fundadvice.com/articles/buy-hold/the-ultimate-buy-and-hold-strategy.html
Constructing an ETF portfolio using the component ideas mentioned in the article would give an individual a very well diversified portfolio. Here is my account compared to similar indexes over a year's time:
[chart]www.aim-users.com/UBH_vs_Index.gif[/chart]
GENERAL INFORMATION ON ETFs
http://quotes.nasdaq.com/asp/ETFsHome.asp
LOOK UP SPECIFIC INDUSTRIAL SECTORS AS ETFs
http://quotes.nasdaq.com/asp/ETFsSector.asp
POWERSHARES ETF SITE
http://www.powershares.com/
INFORMATION ON ETFs
http://www.etfguide.com/etftickerguide.php
MOST POPULARLY TRADED
http://money.cnn.com/funds/etf/mostpop/
HEATMAP OF ETFs
http://screening.nasdaq.com/Heatmaps/Heatmap_ETF.asp
SPECIFIC INFORMATION ON CLOSED END ETFs (CEFs)
http://www.etfconnect.com/
TOM'S RETIREMENT ACCOUNT BUILT WITH ETFs
http://www.aim-users.com/etfunds.htm
EXAMPLE OF NON-U.S. ETF PORTFOLIO
http://www.aim-users.com/exusetf.htm
MORE ON A.I.M. (Automatic Investment Management)
IHub - http://www.investorshub.com/boards/board.asp?board_id=949
Web Site - http://www.aim-users.com/
Best regards, Tom
| Volume | |
| Day Range: | |
| Bid Price | |
| Ask Price | |
| Last Trade Time: |


