 News
News  Market Data
  Discover
Support: 888-992-3836
Copyright © 2023 InvestorsHub Inc.


Register for free to join our community of investors and share your ideas. You will also get access to streaming quotes, interactive charts, trades, portfolio, live options flow and more tools.
Natural Gas Rebound Faces Resistance at Moving Average Zone
By: Bruce Powers | April 18, 2024
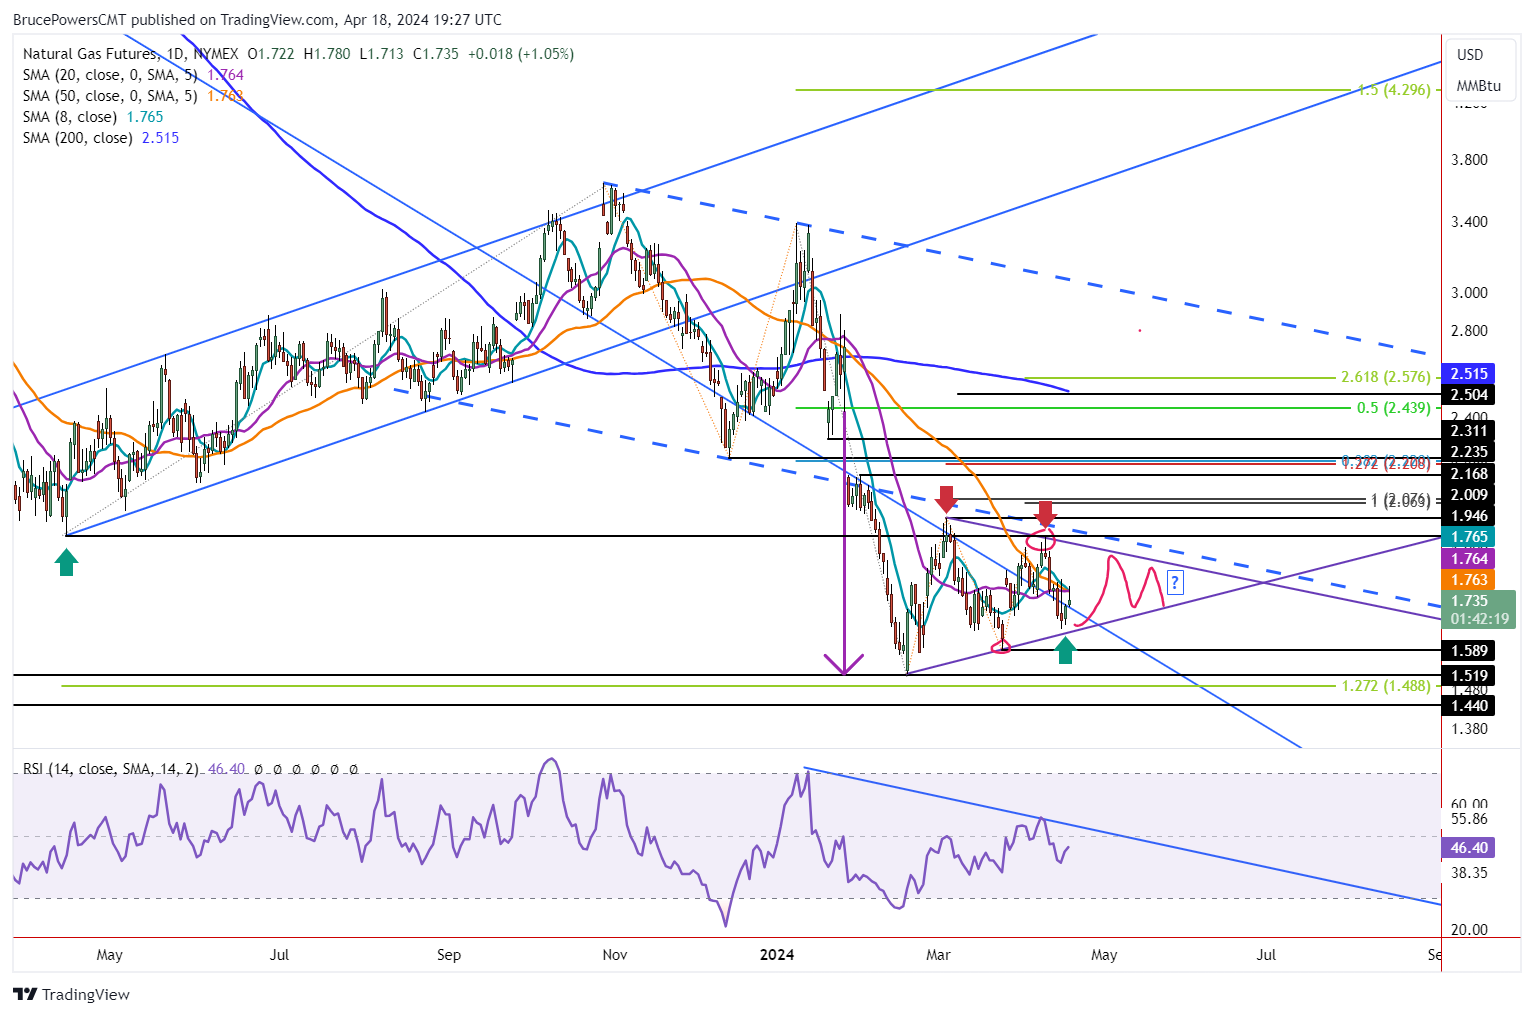
• Trading in natural gas expected to be choppy, as volatility declines in the narrowing pennant.
Natural gas bounces to test a moving average resistance zone with the day’s high of 1.78. Today’s advance (Thursday) broke out above the high of Wednesday, which was an inside day. Natural gas is on track to end the day above yesterday’s high of 1.72. However, it remains inside the wide trading range from Monday, and it is also within a developing bearish pennant consolidation pattern.
Signs of strength seen today may take the price of natural gas up to the top boundary line to test resistance. However, it is not clear whether Tuesday’s swing low will be the low of the swing until there is an advance above Monday’s high of 1.80.
Choppy Moves While in Consolidation
Until natural gas breaks out of the pennant consolidation pattern trading will likely be choppy and difficult to predict, as with any consolidation period. Volatility can be expected to decline as the pennant narrows the trading range as the apex of the triangle is approached.
Further, the three moving averages representing different time frames of 8-Day, 20-Day, and 50-Day have converged. This is another indication of low volatility. How natural gas behaves when testing the upper or lower boundary lines will provide clues as you whether a breakout to the upside or downside may occur.
Consolidation Could Continue for Weeks
The pattern is bearish since natural gas remains in a downtrend and there was a sharp decline prior to the formation of the pennant. Nevertheless, it is not determined until a breakout occurs. A breakout either up or down should occur before the apex is reached. This means that trading within the pennant could go on for as long as more seven weeks. Regardless, a breakout could occur at any time as the pennant is already well defined.
8-Week Moving Average Recaptured
It is interesting to note that there was a breakdown from last week’s bearish shooting star candlestick pattern (not shown) before this week’s low of 1.65 was reached, leading to a bounce. Also, the 8-Week MA, which had marked support for the last two weeks was broken to the downside. Today’s advance has recaptured the 8-Week MA, a sign of strength. Confirmation of strength will be provided on a daily close above the current price for the 8-Week MA at 1.75. Natural gas exceeded that level today.
Read Full Story »»»
 DiscoverGold
The Corn & Ethanol Report
By: Daniel Flynn | April 18, 2024
We kickoff the day with Export Sales, Initial Jobless Claims, Philadelphia Fed Manufacturing Index, Continuing Jobless Claims, Jobless Claims 4-Week Average, Philly Fed Business Conditions, Philly CAPEX Index, Philly Fed Employment, Philly Fed New Orders, and Philly Fed Prices Paid at 7:30 A.M., Fed Bowman Speech at 8:05 A.M., Fed Williams Speech at 8:15 A.M., Existing Home Sales, Existing Home Sales MoM, and CB Leading Index at 9:00 A.M., EIA Natural Gas Storage at 9:30 A.M., Fed Bostic Speech at 10:00 AM.,4-Week & 8-Week Bill Auction at 10:30 A.M., 5-Year TIPS Auction at 12:00 P.M., and Fed Bostic Speech at 4:45 P.M.
Grain futures are mixed in a reversal of yesterday with corn & soybean futures lower while wheat futures get a dead cat bounce. Low volume totals reflect lack of trading interest as the bulls & Bears debate the upcoming Northern hemisphere growing season.. Expect another choppy trade in today’s action with a modest bounce on Friday as we head into the weekend with many geo-political risks-on-at play. The Phillips 66Rodeo California Refinery (Rodeo Renewed) announced it is operating and producing 27,000 barrels of renewable diesel daily as of April 15th . Rodeo Renewable plans to reach it’s plant’s production capacity of 50,000 barrels per day later this quarter. At the current rate of renewable diesel production, the Rodeo Phillips 66 plant is consuming 8.6 Mil pounds of feedstocks daily with a push to reach 16.1 Mil pounds of feedstock consumption by late June. At capacity, this would add 15% of US biofuel production. Rodeo is the largest US biofuel producer and will significantly boost US renewable diesel production. Phillips 66 has not announced what feedstocks the plant will utilizing, but soybean oil should hold a sizable percentage of the feedstocks based on current price relationships, The US Soybean Crush industry has been waiting for Rodeo to come online for years. And talk of squeezing out more fuel from the Strategic Petroleum Reserves (SPR’s) instead of replenishing always at a loss from where and when the government tap’s into the Reserves. This is dangerous to National Security as the administration as both domestic and foreign policy extremely dangerous and just another self-inflicted failure that needs to be held accountable.
The Rosario Grain Exchange raised corn crop size questions on Wednesday with their crop size questions suggesting that corn stunt losses could grow with N Argentine fields reporting harvested yield losses of 40-50%. Also, corn stunt disease has pushed unusually far south into Central Santa Fe and Cordoba. BAGE may further lower their ’24 Argentine corn production estimate later today, but additional harvest data is required to define the disease’s full impact. Play It Again Sam! For the Bears & Bulls it’s the US Marine line of Hurry Up & Wait!
Read Full Story »»»
DiscoverGold
Commodities Daily Market Movers (% Price Change)
By: Marty Armstrong | April 18, 2024
• Top Movers
LBMA Silver in USD 0.74 %
• Bottom Movers
Tokyo Platinum Futures 2 %
NSW Baseload Electricity Continuous 1 %
Tokyo Rubber Futures 0.89 %
AU - Victoria Base-Load Electricity Futures 0.58 %
Tokyo Corn Futures 0.27 %
*Close from the last completed Daily
DiscoverGold
You Can’t Hurry Cuts. The Energy Report
By: Phil Flynn | April 18, 2024
Jerome Powell hints: You can’t hurry cuts. No, you’ll just have to wait. Inflations not easing, But It’s a game of give and take. You can’t hurry cuts, no, you just got to wait, just trust in the Fed’s time, it’s a game of interest rates. How many heartaches must we stand before inflation’s so tame to let us live again. Rate cuts were the only thing that kept us hanging on. When I feel my paycheck, you know it’s almost gone. No, you can’t hurry cuts….
Well after trying to hold support for days, the market had the rug pulled out from underneath it as the market seemed to lose the Fed and the Strategic Petroleum Reserve (SPR) put in quick succession. Backing off rate cuts and the Biden administration switching to a potential seller from a buyer for the SPR took away the invisible floor that oil had. We also saw an easing of war premium in part because of an Axios report that said that Israel considered a retaliatory strike against Iran on Monday but decided to wait.
The market also was less than inspired by the weekly Energy Information Administration (EIA) status report that seemed to suggest the gasoline demand in the United States is struggling but at the same time so are the inventories of oil products. Yet the tightness of diesel supply and gasoline, especially in certain parts of the country, seem to be overshadowed as the market tries to reprice oil and gas in an environment where we might not get any rate cuts this year after all and perhaps a measured response to Iran’s unprecedented attack on Israel.
Federal Reserve Bank of Cleveland President Loretta Mester seemed to echo the sentiment from Fed Chair Jerome Powell by saying monetary policy is in a good place, adding that the central bank shouldn’t be in a hurry to cut interest rates. Yet by backing off the suggestion that rate cuts would be coming, it took away what some might say was the Fed oil put that would keep a floor under oil just a day after the Biden administration took away the Strategic Petroleum Reserve put by saying that instead of buying back for the reserve they might be selling.
Add to that its seems that the market believes that the Biden administration will not impose sanctions on Iranian oil because they fear a shortage. Even so called reimposition of oil sanctions on Venezuela will not impact their exports to the US ahead of the election. Bloomberg News reports they intend to reimpose oil sanctions on Venezuela, ending a six-month reprieve, if Nicolas Maduro’s regime does not take steps in the next two days to honor an agreement to allow a fairer vote in elections scheduled for July.
The US plans to allow a Treasury Department license permitting oil and gas production to expire without renewal on Thursday, according to people familiar with the plan, who asked not to be identified without permission to speak publicly if Venezuela fails to act. Sounds ominous but as oil analyst Anas Alhajji points out, the reimposition of sanctions will not cover Venezuela’s oil exports nor U.S. oil imports from Venezuela. So, while the Biden administration is trying to act tough protecting free and fair elections, they are more worried about the price of oil and diesel hurting their reelection chances.
In fact, John Kemp at Reuters pointed out that Brent crude oil calendar spreads have continued to soften as traders downgrade the probability the conflict between Iran and Israel will escalate to the point where it disrupts oil production and exports. The spread from June to December 2024 has fallen to its lowest for more than five weeks. Most of the softening has come in the nearest-to-deliver June-July and July-August spreads where most of the speculative money is concentrated and where the supply-demand balance would be impacted most immediately by any escalation that threatened oil production and exports from the Persian Gulf. Traders have concluded Iran will not risk any disruption of its exports; the United States will not risk higher oil prices in an election year; and the United States will restrain the next round of responses by Israel. Then again, if it does happen, well, stay tuned.
How about gasoline futures which in recent days has been surging also saw the bottom drop out after the Energy Information Agency {EIA) report. The market became concerned about the strength of the consumer after another week of subpar 8.862 million barrels a day demand. Even though it was stronger than the week before, the market is concerned that this summer driving season might not be getting off to a bang up start.
We did see a big rebound in U.S. oil exports that surged to a whooping 4.726 million barrels a day, that probably included some post Easter Holiday work. Then I would have to say that the report really wasn’t bearish. In fact, I would suggest you could even see green shoots in this report that would suggest more bullishness in the weeks to come. Yet when we lost the Fed put and with the market taking off some more premium, we started the see people’s online positions after they took out support.
According to the EIA, demand in the four-week moving average, which is really what you must keep an eye on, showed that based on total products supplied over the last four-week period averaged 19.8 million barrels a day, down by 0.2% from the same period last year. Over the past four weeks, motor gasoline products supplied averaged 8.8 million barrels a day, down by 1.9% from the same period last year. Distillate fuel product supplied averaged 3.5 million barrels a day over the past four weeks, down by 8.4% from the same period last year. Jet fuel product supplied was up 0.8% compared with the same four-week period last year.
EIA said supplies of U.S. commercial crude oil inventories (excluding those in the Strategic Petroleum Reserve) increased by 2.7 million barrels from the previous week. At 460.0 million barrels, putting U.S. crude oil inventories are about 1% below the five year average for this time of year. Total motor gasoline inventories decreased by 1.2 million barrels from last week and are about 4% below the five-year average for this time of year. Finished gasoline inventories increased, while blending components inventories decreased last week. Distillate fuel inventories decreased by 2.8 million barrels last week and are about 7% below the five-year average for this time of year.
After taking off support both oil and products are vulnerable from a price standpoint. There is still geopolitical risk in the marketplace even though it’s been downplayed in the short term. If the demand side of the equation bounces back just a little bit, we can see by the inventories that supplies will tighten significantly. And while right now we are vulnerable to see oil retest near $80.00 a barrel, we believe it would be prudent to put on some call positions on breaks.
Gas producers are praying that today’s natural gas inventory report will throw them a lifeline so they can survive another week. The U.S. likely saw a below-average build in natural gas inventories last week, lowering slightly the storage surplus as the injection season gets under way, according to a survey by The Wall Street Journal. Natural gas in underground storage is expected to have increased by 45 billion cubic feet to 2,328 Bcf as of April 12, according to the average estimate of nine traders, brokers and analysts. Estimates range from a storage increase of 39 Bcf to one of 51 Bcf.t Journal writes that “the EIA is scheduled to report last week’s storage levels on Thursday at 10:30 a.m. EDT. The projected rise is smaller than the five-year average injection for the week of 61 Bcf and would reduce the surplus from 633 Bcf the week before. The large surplus over the five-year average follows an unusually mild winter that limited inventory drawdowns. The U.S. Energy Information Administration estimates that natural gas in storage will end the injection season at a record 4,120 Bcf, or 10% above the five-year average.
Read Full Story »»»
DiscoverGold
Natural Gas Volatility Decline Setting Stage for Pennant Breakout
By: Bruce Powers | April 17, 2024
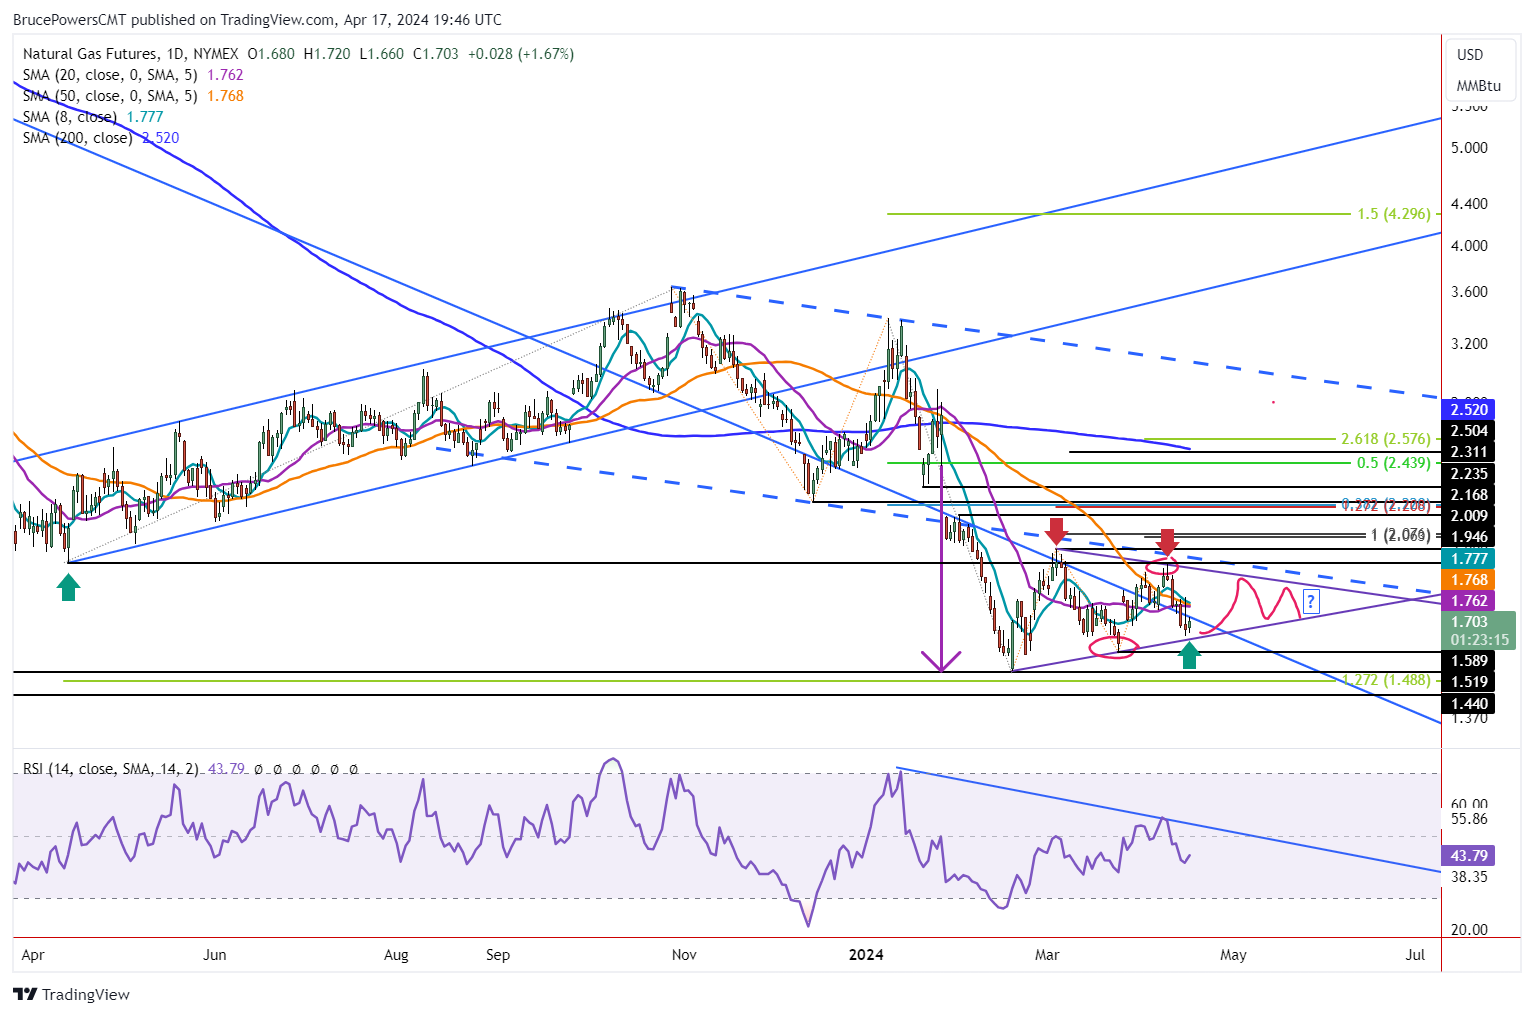
• Natural gas is consolidating within a bear pennant pattern, with volatility declining as it trades inside a narrowing price range.
Natural gas further consolidates on Wednesday within a bear pennant pattern. It is on track to end the day as a relatively narrow inside day. Yesterday’s low of 1.65 approached a test of support at the lower trendline of a developing bear pennant consolidation pattern. This week’s decline has clarified that pattern as an attempt to hold support above the 50-Day MA and long-term trendline failed earlier this week.
Declining Volatility Likely to Continue
Volatility has been declining and it will likely continue to fall as natural gas further trades inside the small triangle pattern with a narrowing price range. The decline in volatility is also indicated by the three moving averages that have converged. The 8-Day, 20-Day, and 50-Day have come together.
What follows a period of low volatility is a clear increase in volatility. That will likely happen upon a breakout of the pennant. Natural gas remains in a clear downtrend and there was a relatively sharp decline prior to the pennant consolidation pattern. However, the downside may be limited.
29-Year Low is 1.44
In June 2020 a low of 1.44 was reached and price was quickly rejected to the upside. Natural gas traded below the prior support level of 1.52 for only one day before buyers took back control and the early stages of an advance began. That is the lowest price that natural gas has traded at in approximately 29 years. This means that 1.52 is a key low price to watch if a breakdown from the pennant occurs. Given the quick rebound off the 1.44 price level it seems unlikely that that price area will be tested again as support. Nevertheless, it is always a possibility.
Breakdown Signal
Until it is clear that Tuesday’s low of 1.65 is going to be a swing low, a breakdown is triggered on a drop below the earlier swing low at 1.59. It is confirmed on a daily close below that price level. Otherwise, support is likely to continue to be seen near the lower boundary line with trading contained within the pattern. Such a low volatility environment is likely to keep some traders on the sidelines until price breaks out.
Upside Trigger
Although the bear pennant is considered a trend continuation pattern, it is not valid until a breakout is triggered. Therefore, an eventual upside breakout remains a possibility. An upside breakout is triggered on a move above the recent swing high of 1.94. The next time that a bullish breakout could occur would be on the next rally towards the top of the pattern if it does occur.
Read Full Story »»»
DiscoverGold
Agriculture Master Report
By: Bill Moore | April 17, 2024
JULY CORN
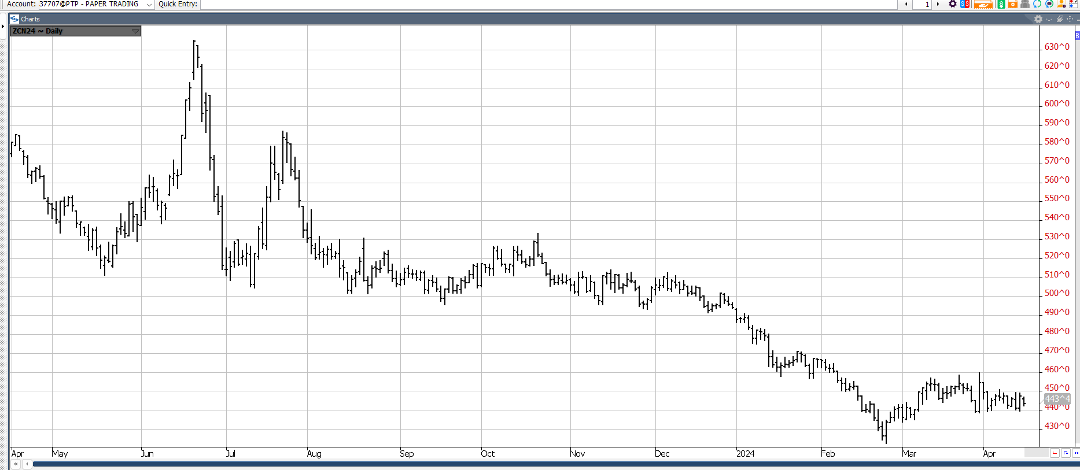
For the past 6 weeks, July Corn has been locked in a tight 20 cent range (440-460), as headwinds such as planting pressure, rains in the dry areas , the Iranian airstrike & the April WASDE Report push it down to the 440 level & tailwinds such as todays export at inspections 1.333 mmt & todays flash sale of 165,000 mt to Mexico lift it to the 460 level! Traders were generally disappointed by the wide disparity in the South American estimates tssued last Friday between the USDA (124) & CONAB (112) & feel the May WADSE will correct it! Common sense would say Brazil has a better handle on their crop size than the USDA!
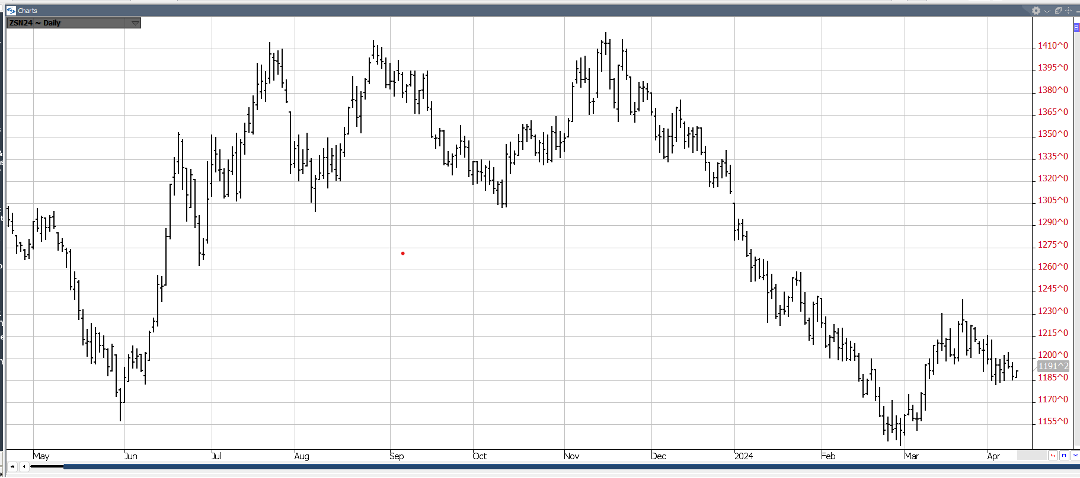
JULY BEANS
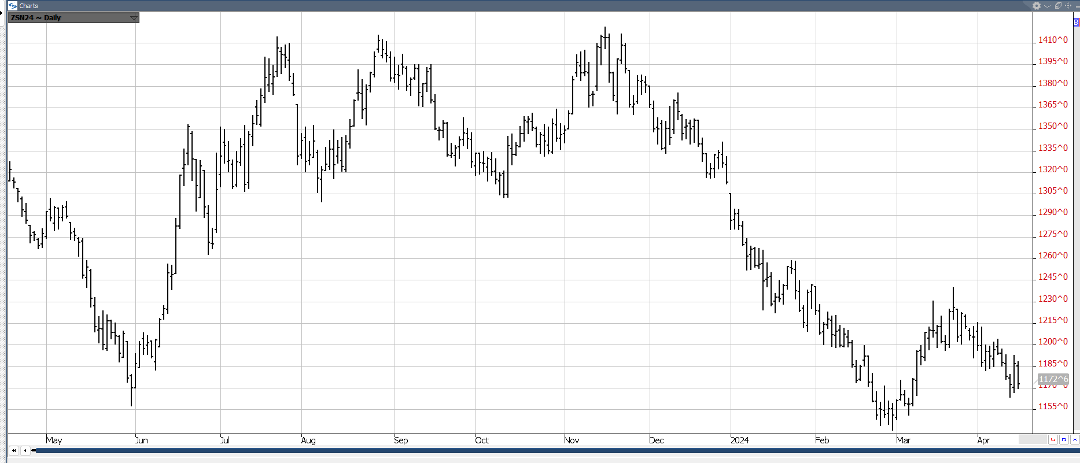
1155 to 1230 has confined July Beans since Mar 1 as it also labors in a tight range buffeted by both positives & negatives! This past week, 3 export flash sales were reported to unknown destinations – 124,000, 254,000 & 124,000! But offsetting that was the USDA report last Thur at 11am CST – keeping the Brazil Beans at 155mmt vs the Conab estimate of 146mmt! This is a very wide discrepancy for this late in the growing season & we expect it to be rectified in the MAY WADSE REPORT! Meanwhile, the mkt is closely monitoring the early planting progress – with corn at 6% & beans at 2-3% complete – due out today at 3pm! With the mkt $2.50 under last Summer & a still sizeable short fund open interest, we feel the mkt leans to an upside bias – when it finally emerges from its sideways, consolidation pattern!
JULY WHT
July Wheat was able to back-and-fill its way higher for about a 40 cent rally – before the mkt’s negative reaction to last Thur’s WASDE forced a correction! However, we feel Russian’s recent export woes, the escalating Middle-East conflict, recent Russian military strikes & general dry conditions of their emerging wht crop all favor less production & more exports – and therefore higher prices!
JUNE CAT
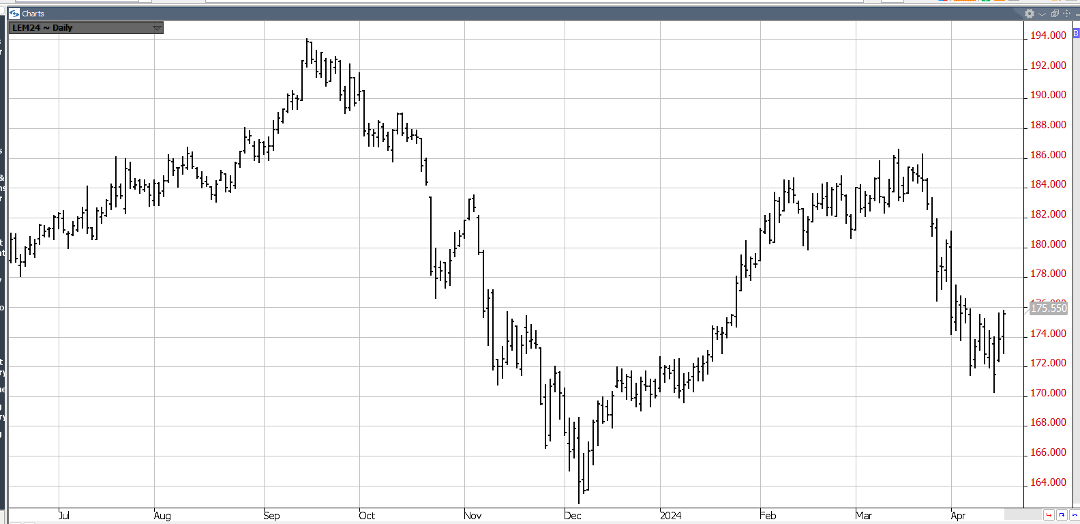
Since late March, June Cattle has plummeted $16 (186-170) – mostly off the impetus of a bearish March Cattle-on-Report which reported placements at 10% over 2023 (est-6%)! The downswing was then exacerbated by the Bird Flu Epidemic which cast serious doubt on beef demand! However, this incident was later mitigated – leaving the mkt sharply over-sold! So, a fierce short-covering rally (170-176) ensued – sparked by our entry into the Spring Grilling season – the best demand period of the year! We look for the mkt to continue to recoup part of the $16 loss – triggered by the fateful March 22nd Cattle-on-Feed Report!
JUNE HOGS
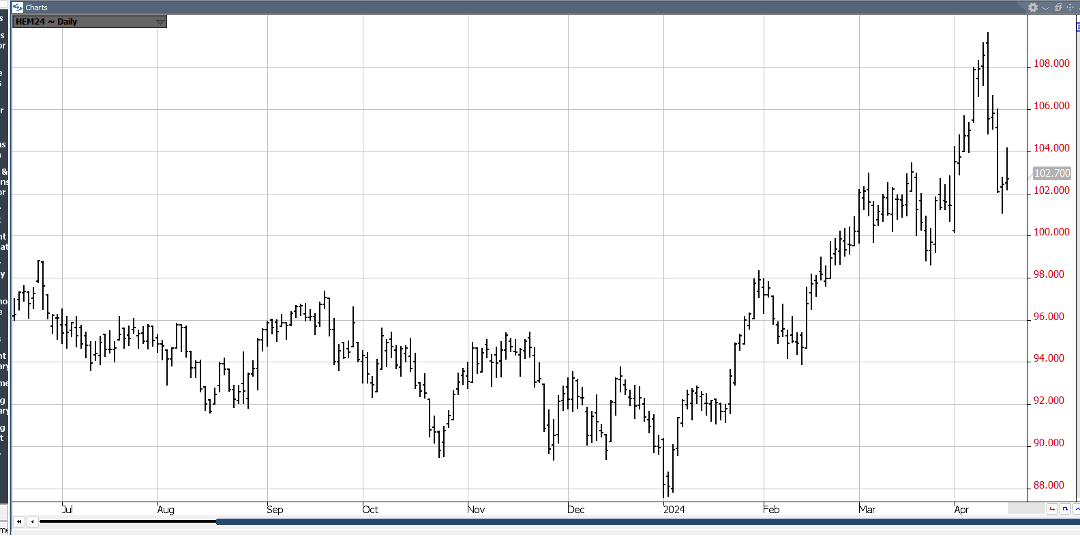
On April 10th, a major Key Reversal occurred – with new contract highs scored early in the trading session – followed by a precipitous decline of nearly $5.00 & a close well under the previous 2-wk lows! The mkt continued down another $4-5.00 to last week’s low of about $101 – as heavier slaughter & pork production fueled the down! But after nearly an $8.00 drop, the mkt became quite oversold & being amidst the best demand period of the year, has rallied back $3.00! We look for all the outdoor grilling to push the mkt back up toward it early April highs! Helping that rally is the fact that China’s 1st Qtr pork production declined to 15.8 million tons – the first qtly fall in 4 years! This seems to indicate that they are finally getting their excess production under control – a positive for pork exports!
Read Full Story »»»
DiscoverGold
Biden’s Oil World. The Energy Report
By: Phil Flynn | April 17, 2024
Wars, rumors of war, record deficits, raging inflation and threating more taxes and regulations on US energy as Iran’s Oil production is allowed to hit a 5 and a half year high and they secretly meet with the Maduro regime while having to decide this week as to whther or not to impose sanctions. And now with the supplies of aluminum platinum tightening ask the CME Group and the London metals exchange decides to not deal with the Russian supply the Biden administration is now suggesting tariffs on Chinese metals.
Oil prices are pulling back as Israel has yet to respond to Iran’s unprecedented attack and stubborn inflation has Jerome Powell said that “If price pressures persist, the Fed can keep rates steady for “as long as needed” and the Biden administration and White House senior adviser John Podesta hinted at another release from the Strategic Petroleum Reserve to try to ease rising gas prices and try to improve his boss’s political fortunes.
The Biden Administration has made no bones about it that the mission of the SPR not just to be used in an emergency but as a political piggy bank where he can use taxpayer paid for oil to improve his political fortunes. Kind of like defying the Constitution and the Supreme court to use your money to pay off some college loans. Yes, President Biden has done this before releasing oil from the SPR before he welcomed a ‘minor incursion” by Russia into Ukraine and before his failed policy of deterrence with sanctions on Russia.
This comes as the American Petroleum Institute released a report that shows that gasoline inventories are tightening as well as diesel but did see an increase in crude oil supply. API reported that gasoline supplies fell by 2.51 million barrels in the current week. AAA pots gas prices at $3.660 A gallon up from $3.644 yesterday and up from $3.461 a month ago, Year over year they are about a penny lower, and that was when the market was getting regular released from the SPR that could be exported to China and India and Europe. Yes, oil exports in the US did hit record highs as we drained our SPR.
So, it’s probably good news that the API reported that we saw crude inventories rise by 4.09 million barrels, but it is more than likely that that’s going to change as refiners have to ramp up production. Gasoline supplies are below normal and so we’re distilling inventories and they fell to 427,000 barrels. The smaller than expected 169,000 drawdown and Cushing OK may be a sign that the crude oil supply increases could be coming to an end and that may pressure the Biden team to use SPR oil once again in an attempt to keep down gasoline prices.
First behind the backdrop is the market waiting to see how Israel is going to respond to that unprecedented attack by Iran on its own soil it seems like Iran is taking steps because I think they are starting to realize that after their failed assault maybe they bit off a little bit more than they can chew. Today Iran is talking about letting in nuclear weapons inspectors from the International Atomic Energy agency which would be the first time this year.
Bloomberg reported that Rafael Mariano Grossi, director-general of the UN’s nuclear watchdog, will visit Iran “soon,” the head of the Atomic Energy Organization of Iran said on Wednesday, according to the state-run Hamshahri newspaper. Mohammad Eslami said the date of Grossi’s visit had not yet been decided, Hamshahri reported. He also said that International Atomic Energy Agency cameras were installed and “constantly monitoring” Iran’s nuclear facilities. Remember the AP reported that the head of the International Atomic Energy Agency said Wednesday that Iran’s decision in September to bar several experienced U.N. inspectors from monitoring the country’s nuclear program constituted “a very serious blow” to the agency’s ability to do its job “to the best possible level” last November.
And while traders may be selling futures at the same time, we’re seeing a record amount of call buying for just in case scenarios some of the calls amazingly enough our way out of the money $250 Brent crude calls. If you buy enough of those options and you’ll get a spike in the price of crude oil you don’t have to get anywhere near $200 a barrel to do very well on a very cheap investment still it’s a long shot but it’s interesting that some serious money is making that bet.
of course geopolitical events sometimes really put a different perspective on good old fashioned supply and demand fundamentals. Once we see a significant change in the economic outlook the global oil market is going to continue to be undersupplied for the rest of the year. Misuse of strategic petroleum reserves around the world have discourage investment along with ESG responsible for taking away much needed funds from fossil fuel investment and putting them into other types of things that will not be able to help the global economy in the short run so it’s no wonder that these losing ESG investments s that were based more in false virtue instead of common sense Have some investors fleeing the sector and droves.
The American Petroleum Institute also is warning that Bidens lessee ban on Federal land is going to be bad for US economy and taxpayers. The API says “As energy demand continues to grow, oil and natural gas development on federal lands will be foundational for maintaining energy security, powering our economy and supporting state and local conservation efforts. Overly burdensome land management regulations will put this critical energy supply at risk. We are reviewing the rule to ensure the Biden administration is upholding its responsibilities to the American taxpayers and promoting fair and consistent access to federal resources.”
They point out some of the benefits that we will forgo such as the fact that “In FY 2022, onshore federal oil and natural gas development supported nearly 250,000 jobs, generated $19.4 billion in labor income, and contributed $36.7 billion to GDP.
In FY 2022, oil production on federal lands averaged 1.2 million barrels per day and marketed natural gas production averaged over 9 billion cubic feet per day. Between FY 2013 and FY 2022, oil and natural gas production on federal lands generated a total of $35 billion in disbursement revenue from bonuses, rents, and royalties, averaging approximately $3.6 billion per year. 53% of this disbursement revenue, totaling more than $19 billion, went to the federal government or programs, while state and local governments received the remaining 47%, totaling $16 billion.
In FY 2022, federal oil and gas development in the five highest producing states supported more than 170,000 jobs and more than 75,500 jobs in other U.S. states mainly through the supply chain and other purchasing. New Mexico: 105,300 jobs/ Wyoming: 24,400 jobs/Colorado: 21,000 jobs/Utah: 11,200 jobs/North Dakota: 10,000 jobs.
I guess we all wonder why that the Biden Administration is not as tough in enforcing Iranian sanctions and sanctions on Venezuela.
Who winters over winter is not over until we say it is. OK maybe that’s a little bit strong but we did get a little bit of a rebound in the beleaguered natural gas market after a report that we could get a may freeze. This is why here in Wisconsin you better not plant those flowers until Mother’s Day. Yet the overall outlook for natural gas continues to be bleak. EBW Analytics says that The mini rally in the May contract crashed lower last week as daily heating demand collapsed and acute weakness in LNG exports emerged alongside a bearish EIA storage surprise. Henry Hub prices in the $1.30s/MMBtu remain an alarming bearish warning sign of downside risks ahead of May expiration.
Acute weakness in LNG feedgas demand collapsing sub-10 Bcf/d represents near-term risks, although a probable rebound higher could help stabilize prices.
Natural gas production scrapes continue to descend more rapidly than projected, offering bullish upside into summer. Still, weak EIA storage figures pose a risk that imprecise pipeline scrapes may overstate supply losses. Near-term difficulties in sustainably lowering the storage surplus indicate likely continued weakness for near-term NYMEX futures. As weather headwinds ebb and storage surpluses decline into summer, however, natural gas may rise.
Read Full Story »»»
DiscoverGold
Lumber forming the dreaded tear drop pattern and is on track for its 11th consecutive red day
By: Barchart | April 16, 2024
• Lumber forming the dreaded tear drop pattern and is on track for its 11th consecutive red day.

Read Full Story »»»
DiscoverGold
Cocoa is crashing down 8.54% today
By: Markets & Mayhem | April 16, 2024
• Cocoa is crashing down 8.54% today.

Read Full Story »»»
DiscoverGold
Grains Report: Wheat, Rice, Corn and Oats, Soybeans, Canola and Palm Oil
By: Jack Scoville | April 16, 2024
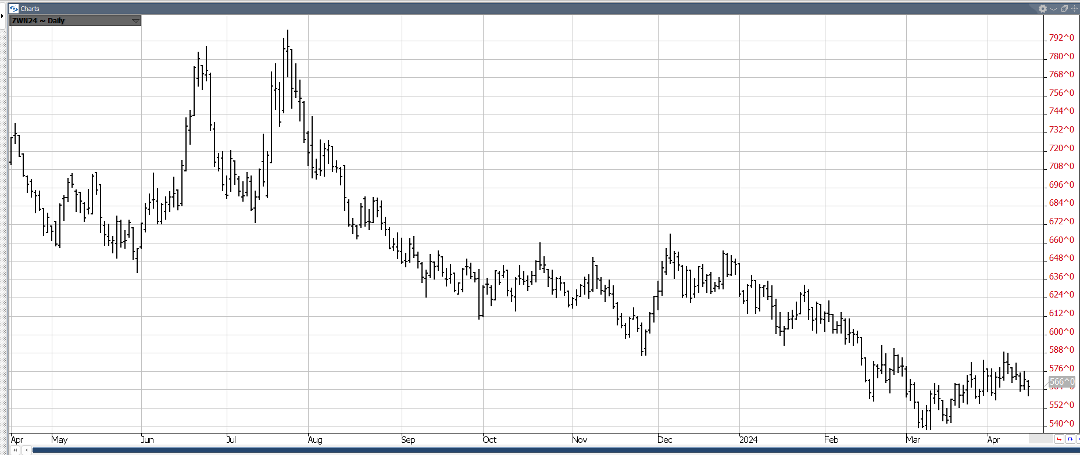
• WHEAT
General Comments: Wheat was lower yesterday in range trading. Trends remain mixed in all three markets. The problems with Russian Wheat exporters continue. The reports indicate that the government is seeking more control of the exports and has made life very difficult on the private exporters in an effort to extract more sales and powers to the government. Russia is the world’s largest exporter and sets the world price and prices remain low. Big world supplies and low world prices are still around. Export sales remain weak on competition from Russia, Ukraine, and the EU as those countries look to export a lot of Wheat in the coming period. Black Sea offers are still plentiful, but Russia has been bombing Ukraine again and shipments might be hurt from that origin.
Overnight News: The southern Great Plains should get mostly dry conditions. Temperatures should be above normal. Northern areas should see mostly dry conditions. Temperatures will average above normal. The Canadian Prairies should see mostly dry conditions. Temperatures should average above normal.
Chart Analysis: Trends in Chicago are mixed. Support is at 539, 537, and 527 May, with resistance at 568, 575, and 580 May. Trends in Kansas City are mixed. Support is at 571, 561, and 552 May, with resistance at 597, 602, and 605 May. Trends in Minneapolis are mixed. Support is at 634, 625, and 618 May, and resistance is at 650, 655, and 660 May.
• RICE
General Comments: Rice closed sharply higher yesterday as the long liquidation by the funds is now complete. Futures were a little weaker at points during the week in reaction to the USDA supply and demand reports, but the rebound from the fund selling was more important. USDA cut domestic demand a lot but increased export demand for increased ending stocks levels. USDA also increased world ending stocks estimates for the year. Trends are up in this market on the daily charts. The market noted good planting and emergence progress in the weekly USDA reports released on Monday afternoon. Good demand for exports continues.
Overnight News:
Chart Analysis: Trends are up with no objectives of 1748 May. Support is at 1800, 1778, and 1725 May and resistance is at 1850, 1870, and 1907 May.
• CORN AND OATS
General Comments: Corn closed lower and Oats closed higher yesterdAY as traders think that good Spring weather here will greatly increase planted Corn area. The USDA supply and demand reports showed reductions in Corn ending stocks in line with trade expectations but still over 20 billion bushels. Increased demand was noted in all domestic categories, but export demand was left unchanged. South American production estimates were little changed. It is very expensive to plant Corn and Corn is considered unprofitable to plant right now, so planted are might not increase that much if at all. USDA issued its crop progress report for Corn and Corn planting is proceeding slowly. Demand for Corn has been strong at lower prices. Big supplies and reports of limited demand are still around, but futures have been very oversold. Funds remain very large shorts in the market.
Overnight News:
Chart Analysis: Trends in Corn are mixed. Support is at 426, 422, and 408 May, and resistance is at 437, 448, and 459 May. Trends in Oats are mixed. Support is at 344, 339, and 334 May, and resistance is at 369, 362, and 369 May.
• SOYBEANS
General Comments: Soybeans and Soybean Oil closed lower and Soybean Meal closed higher last week in response to the USDA supply and demand estimates that showed a greater increase in US ending stocks than the market had anticipated. South American production estimates were little changed. Brazil producers had been taking advantage on higher futures in the US and higher basis levels in Brazil, but the basis has fallen sharply in Brazil this week and sales have been less. Reports of great export demand in Brazil provide some support. Reports indicate that China has been a very active buyer of Brazil Soybeans this season. Ideas that South American production is taking demand from the US have pressured futures lower. Funds remain large shorts in the market. The US reports strong domestic demand.
Overnight News:
Chart Analysis: Trends in Soybeans are mixed. Support is at 1166, 1152, and 1140 May, and resistance is at 1181, 1193, and 1207 May. Trends in Soybean Meal are mixed to up with no objectives. Support is at 336.00, 330.00, and 325.00 May, and resistance is at 348.00, 352.00, and 35=7.00 May. Trends in Soybean Oil are down with objectives of 4430 May. Support is at 4520, 4420, and 4360 May, with resistance at 4730, 4830, and 4980 May.
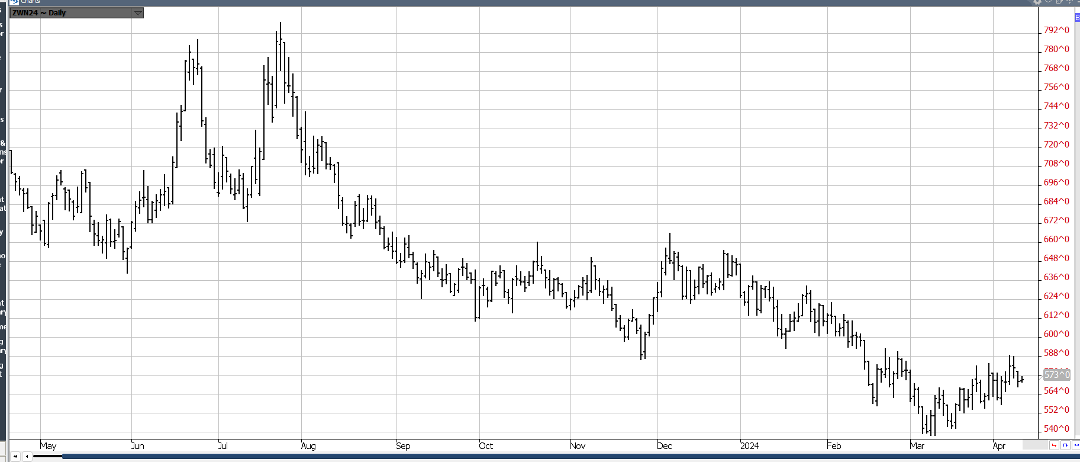
• CANOLA AND PALM OIL
General Comments: Palm Oil was lower last week in sympathy with the price action in Chicago and on demand concerns. It wqs lower today on ideas of demand weakness. The export pace is expected to continue to really improve but this is part of the price already, in part due to stronger world petroleum prices that have affected world vegetable oils prices as well. Domestic biofuels demand is likely to improve. Ideas of weaker production ideas against good demand still support the market overall. Trends are turning up on the daily charts. Canola was lower in response to the USDA reports that showed plenty of oilseeds viable in the US and the world and on price action in Chicago.
Overnight News:
Chart Analysis: Trends in Canola are mixed to down with objectives of 617.00 and 596.00 May. Support is at 620.00, 616.00, and 610.00 May, with resistance at 637.00, 645.00, and 652.00 May. Trends in Palm Oil are mixed. Support is at 4110, 4040, and 3920 July, with resistance at 4180, 4220, and 4300 July.
Midwest Weather Forecast
Read Full Story »»»
DiscoverGold
Softs Report: Cotton, OJ, Coffee, Sugar, Cocoa
By: Jack Scoville | April 16, 2024
• COTTON
General Comments: Cotton was a little higher to relieve oversold conditions from weaker demand ideas. The export sales report showed poor dales once again. USDA made no changes to the domestic supply or demand sides of the balance sheets, but did cut world ending stocks slightly. Trends are still down on the daily and weekly charts. Demand has been weaker so far this year. The US economic data has been positive, but the Chinese economic data has not been real positive and demand concerns are still around. However, Chinese consumer demand has held together well, leading some to think that demand for Cotton in world markets will increase over time.
Overnight News: The Delta will get showers and rains and near normal temperatures. The Southeast will see showers and rains and near normal temperatures. Texas will have mostly dry conditions and near normal temperatures.
Chart Trends: Trends in Cotton are down with objectives of 77.20 May. Support is at 81.70, 80.80, and 79.30 May, with resistance of 86.20, 88.20 and 91.40 May.
This Week Last Qeek Last Year Average
Cotton Planted 8 5 7 8
• FCOJ
General Comments: FCOJ closed higher yesterday and remains at the top edge of a trading range. The move came in reaction to the latest USDA reports that showed less production. Florida production is now estimated at 18.8 million boxes, from 19.8 million last month. Reports of tight supplies are around. Florida said that Oranges production will be low, but above a year ago. Futures still appear to have topped out even with no real downtrend showing yet, so a range trade has been seen. Prices had been moving lower on the increased production potential for Florida and the US and in Brazil but is now holding as current supplies remain very tight amid only incremental relief for supplies is forecast for the coming new crop season. There are no weather concerns to speak of for Florida or for Brazil right now. The weather has improved in Brazil with some moderation in temperatures and increased rainfall amid reports of short supplies in Florida and Brazil are around but will start to disappear as the weather improves and the new crop gets harvested.
Overnight News: Florida should get scattered showers or dry conditions. Temperatures will average near normal. Brazil should get scattered showers and above normal temperatures.
Chart Trends: Trends in FCOJ are mixed. Support is at 350.00, 347.00, and 353.00 May, with resistance at 378.00, 389.00, and 391.00 May.
• COFFEE
General Comments: Both markets closed sharply higher yesterday and both show up trends on the daily and weekly charts. The lack of Robusta Coffee in the market continues to support futures. Robusta offers from Vietnam remain difficult to find and the lack of offer of Robusta is a bullish force behind the London market action. There were some indications that Vietnam producers were now offering a little Coffee, but not much and not nearly enough to satisfy demand. Vietnamese producers are reported to have about a quarter of the crop left to sell or less and reports indicate that Brazil producers are reluctant sellers for now after selling a lot earlier in the year. The next Robusta harvest in Brazil is starting now.
Overnight News: The ICO daily average price is now 223.13 ct/lb. Brazil will get mostly scattered showers with near normal temperatures. Central America will get mostly dry conditions. Vietnam will see scattered showers
Chart Trends: Trends in New York are up with no objectives. Support is at 214.00, 210.00, and 208.00 May, and resistance is at 235.00, 238.00 and 241.00 May. Trends in London are up with objectives of 4090 May. Support is at 3840, 3760, and 3700 May, with resistance at 4000, 4030, and 4060 May.
• SUGAR
General Comments: New York and London closed lower again yesterday and trends are down on the charts as the market seems to have supplies available for sale. There are still ideas that the Brazil harvest can be strong for the next few weeks if not longer. Indian production estimates are creeping higher but are still reduced from recent years. There are worries about the Thai and Indian production. Offers from Brazil are still active but other origins. are still not offering in large amounts except for Ukraine. Ukraine offers have suffered lately with the war. Demand reports from Europe have been strong.
Overnight News: Brazil will get rains in the south and scattered showers in the north. Temperatures should average above normal. India will get mostly dry conditions and below normal temperatures.
Chart Trends: Trends in New York are down with objectives of 1950 July. Support is at 2000, 1980, and 1940 July and resistance is at 2050, 2100, and 2150 July. Trends in London are down with objectives of 567.00 August. Support is at 579.00, 574.00, and 568.00 August, with resistance at 600.00, 608.00, and 617.00 August.
• COCOA
General Comments: New York and London were higher yesterday and trends are up. Production concerns in West Africa as well as demand from nontraditional sources along with traditional buyers keep supporting futures. Production in West Africa could be reduced this year due to the extreme weather which included Harmattan conditions. The availability of Cocoa from West Africa remains very restricted and projections for another production deficit against demand for the coming year are increasing. Ideas of tig8ht supplies remain based on more reports of reduced arrivals in Ivory Coast and Ghana continue. Ivory Coast arrivals are now 1,301 tons, down 26.7% from the previous year. Mid crop harvest is now underway and here are hopes for additional supplies for the market from the second harvest. Demand continues to be strong, especially from nontraditional buyers of Cocoa.
Overnight News: Isolated showers are forecast for West Africa. Temperatures will be near normal. Malaysia and Indonesia should see scattered showers. Temperatures should average near normal. Brazil will get isolated showers and above normal temperatures.
Chart Trends: Trends in New York are up with objectives of 11890 May. Support is at 10380, 10000, and 9630 May, with resistance at 11200, 11320, and 11440 May. Trends in London are mixed to up with no objectives. Support is at 8570, 8080, and 7930 May, with resistance at 9320, 9440, and 9560 May.
Read Full Story »»»
DiscoverGold
Inflation Nation Everywhere. The Corn & Ethanol Report
By: Daniel Flynn | April 16, 2024
We start off the day with Building Permits Prel, Building Permits MoM Prel, Housing Starts, and Housing Starts MoM at 7:30 A.M., Redbook YoY at 7:55 A.M., Industrial Production MoM & YoY, Capacity Utilization, and Manufacturing Production MoM & YoY at 8:15 A.M., 42-Day Bill Auction and 52-Week Bill Auction at 10:30 A.M., and API Energy Stocks at 3:30 P.M.
With inflation rocketing out of control and being on the brink of war physical gold and gold futures have repeatedly set new record highs, starting in early March, as buyers seek a home for cash to avoid lost purchasing power in US dollars. Last week, nearby gold futures reached a record high of $2,429/oz. The latest Commitment of Traders report showed that the week ending Apr 9th, funds bought 929 contracts of gold futures and held the largest net long position since July 2020. This is compared to commercial buying of 1,226 contracts, which resulted in a &82.50 price change for the week. The rally in gold prices appears to be much about limited commercial selling. In fact, commercials have been net buyers for the last month. With the US now adding $ 1 trillion in debt every 100 days in this out of sight-out of mind economy. Inflation rates are expected to rise in the coming months further robbing the US dollar for purchasing power. As such, Chinese demand for gold stays strong. In the overnight grain futures started out firmer but sold off due to strengthening US dollar. China’s economy grew at a better than expected 5.3% in the 1st quarter of 2024 on a 14% gain on exports year-over-year. However, Chinese retail sales grew by just 3.1%, which was lower than expectations of 4.6%. The Chinese GP growth helped bump grain/oilseed futures initially higher, but the strengthening dollar acted to tug commodities to weaker morning levels. Geopolitical fears are now also in the mix with runaway inflation and the usual suspects with seedings started and we will watch South American weather and monitor any movement of Ukraine product into the next phase of the US growing season.
Read Full Story »»»
DiscoverGold
Buying Rumors. The Energy Report
By: Phil Flynn | April 16, 2024
Global oil prices went through the ‘buy the rumor sell the fact’ on the Iranian attack on Israel and now are still waiting to see what Israel’s response will be. Reports by the Israeli Defense Minister Yoav Gallant said that Israel would have no choice but to retaliate and reports that the ground invasion in Rafah southern Gaza will be put off until the Iranian response happens. This raises more questions than answers. Iran’s attack on Israel seems to have given Israel surges in international support even by Arab nations that are tired of Iran’s goal to disrupt peace in the region.
Iran is the driving the force between Hezbollah, Hamas and the Houthi rebels that have basically destabilized the region and caused war and turmoil for almost every country in the world. It also clear that the failure to enforce sanctions on Iran has allowed Iran to raise oil output to a 5 and a half year high and the billions of dollars they are reaping for this has gone to fund terror and bloodshed. Now after the attack, many countries are urging Israeli restraint on its response to Iran but secretly behind the scenes, they would love nothing better than to see the Iranian regime fall because of all the havoc that they’ve been causing. Oil prices have sold off because of the expectation that Israel will be measured in the response and is putting pressure on prices, but it may not be long before we start buying the rumor of an attack once again.
Zero Hedge reports that new statements from the Pentagon issued Monday have said the Houthis fired over 90 ballistic missiles and drones – most of which were intercepted by US and allied forces over the past 48 hours, once the Iranian attack kicked off in the overnight hours of Saturday. US Central Command described that at one point during the attack the Houthis fired an anti-ship ballistic missile directly against US Navy and commercial ships in the Gulf of Aden. “There were no injuries or damage reported by US, coalition, or commercial ships,” CENTCOM said.
Oil prices seem to be getting mixed emotions from Chinese economic data. The gross domestic product seems to be better than expected but the report on consumer demand seemed to be disappointing especially because of past reports that over the Chinese holiday domestic demand was at pre COVID levels.
Domestic oil production also increased but make no mistake about it, they’re still going to need a lot of oil from other places. The Wall Street Journal wrote, “With familiar signs of weakness in consumption and real estate in the first three months of the year, many economists say Beijing still isn’t doing enough to support Chinese households and nurture a more balanced recovery. And the loss of some momentum in March compared with the preceding two months reinforced expectations that further stimulus will be needed to ensure that the government meets its growth target of around 5% for the year. China said its economy grew 5.3% in the first quarter compared with the same three months a year earlier, a faster pace than the 5.2% year-over-year growth rate that the country notched in the final quarter of 2023, China’s National Bureau of Statistics said Tuesday. The pickup was propelled by a rise in industrial production and swelling investment in factories. After a challenging few year, Chinese officials are steering activity and investment toward manufacturing and exports to compensate for domestic consumers’ reluctance to spend and a continuing crunch in the property market.”
It is very powerful that yesterday sell off oil price low set the low for the week. We expect modest drawdowns in crude oil and products and today’s American Petroleum Institute report and we expect to see an uptick in demand after the drop in demand that we saw over the Easter holiday weekend. I expect that the exports for oil and gasoline will rebound, and we should see an uptick in gasoline demand as well and with the ongoing risk to supplies, it’s unlikely that the market is at a point where it will collapse.
Reuter reports that – Russia has been able to swiftly repair some of key oil refineries hit by Ukrainian drones, reducing capacity idled by the attacks to about 10% from almost 14% at the end of March, Reuters calculations showed. Ukraine stepped up drone attacks on Russian energy infrastructure since the start of the year, hitting some major oil refineries across the world’s second largest oil exporter in attacks that sent up oil prices.
Natural gas cash prices are falling once again and even with the drop in US natural gas, rigs production may not be falling quite fast enough. Yahoo finance writes, “the bearish sentiment surrounding the commodity even prompted shale producers Chesapeake Energy CHK and EQT Corporation EQT to hit the brakes on new drilling. Chesapeake announced a reduction in its drilling rigs so as to lower volume. The company has decided to cut this year’s gas production expectations by around 20%. Chesapeake’s plans rippled through the market, with Appalachian Basin-focused EQT following on. The explorer and producer of natural gas said that it will lower its daily output by 1 Bcf to combat the supply glut in the U.S. market. According to EQT, the revised plan will likely reduce net production by 30-40 Bcf. While these production cut announcements temporarily drove natural gas prices higher, they have failed to galvanize the market.”
Read Full Story »»»
DiscoverGold
Commodities Daily Market Movers (% Price Change)
By: Marty Armstrong | April 16, 2024
• Top Movers
AU - Victoria Base-Load Electricity Futures 6.52 %
Rough Rice Futures (CBOT) 6.38 %
London Aluminum Spot 4.91 %
Coffee (NYCSCE) Futures 2.9 %
NY Copper Futures 2.83 %
• Bottom Movers
NY Natural Gas Futures 4.46 %
Palm Kernel Oil 3.05 %
London IPE Gas Oil Futures 3.01 %
Gold LBM per Oz (USD) 2.77 %
Zinc (99.995%) Spot 2.77 %
*Close from the last completed Daily
DiscoverGold
Natural Gas Testing Support Amidst Low Volatility
By: Bruce Powers | April 12, 2024
• Natural gas is testing support around the downtrend line and 20-Day MA. Signs of strength are crucial if the rally off trend lows has a chance to continue.
Natural gas dipped briefly below the minor 1.75 swing low from Monday before finding support at 1.73 and stalling the descent. Volatility diminished as it is on track to complete a narrow range day while further testing support around the long-term downtrend line and 20-Day MA, now at 1.76. If natural gas can advance above today’s high of 1.785 heading into next it has a chance to progress the near-term uptrend that starts from the higher swing low and potential second bottom (C).
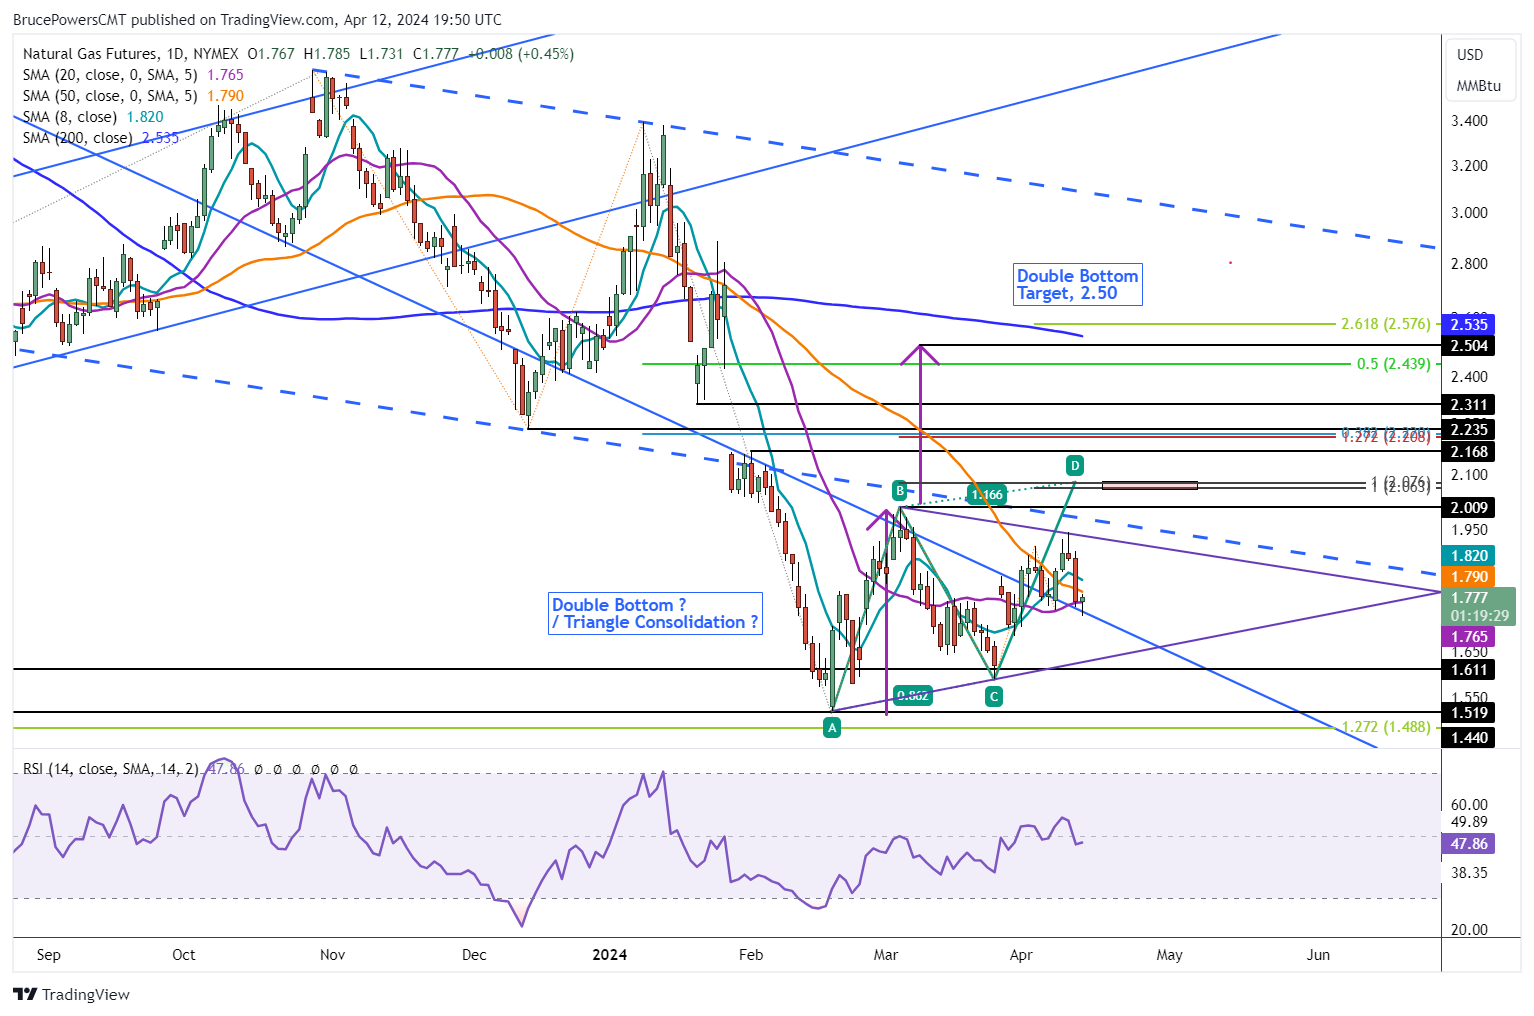
Drop Below Today’s Low Points to Lower Triangle Line
However, a drop below today’s low without a quick recovery increases the chance that natural gas will further trace out a developing symmetrical triangle (purple). A drop below today’s low increases the chance of a test of support at the lower boundary line of the triangle. Recent minor signs of strength seen recently as natural gas recaptured both the 20-Day and 50-Day MAs would then be negated.
Rally Above 1.785 Would Be First Sign of Strengthening
Nevertheless, if natural gas can continue to find support around the downtrend line and 20-Day MA, followed by signs of strength, it will likely have completed a minor pullback. The chance for an eventual bull trend continuation will then become more likely. A rally above today’s high of 1.785 will provide an initial signal, but upside follow through will be key as to whether it can keep rising from there.
Weekly Chart Analysis
On a weekly basis, natural gas is on track to close weak, in the lower third of the week’s range and possibly with a doji. The weekly candle will be bearish unless natural gas can rise before today’s close. Last week also ended relatively weak. This week will be the second in a row where natural gas is closing in the lower area of the week’s range. In both cases support for the week was seen in the 8-Week MA.
Natural gas has been mostly below the 8-Week line since early-January. So, a successful test of support at the 8-Week line is one sign of strength. Regardless, the weekly performance did not confirm strength since this week and last week ended (likely) in the lower part of the range. Therefore, a drop below today’s low would also give a weekly bearish signal relative to this week’s low and the 8-Week MA.
Read Full Story »»»
DiscoverGold
Commodities Daily Market Movers (% Price Change)
By: Marty Armstrong | April 12, 2024
• Top Movers
AU - Victoria Base-Load Electricity Futures 4.05 %
Oats (CBOT) Futures 2.96 %
Oats (Minneapolis) 2.38 %
Coffee (NYCSCE) Futures 2.21 %
Zinc (99.995%) Spot 1.88 %
• Bottom Movers
NY Natural Gas Futures 6.42 %
Cheese 3.82 %
Soybean Oil CBT Futures 3.32 %
London Nickel Spot 3.03 %
Sugar World (CSCE) Futures 2.84 %
*Close from the last completed Daily
DiscoverGold
Natural Gas Testing Support Amidst Consolidation
By: Bruce Powers | April 11, 2024
• Natural gas prices test support at 20-day MA, poised for bullish reversal or failure to lower prices.
Natural gas retreats further from Wednesday’s 1.94 high on Thursday as it tests support around the 20-day MA with the day’s low of 1.77. The 20-Day line is at 1.76 and it is strengthened by the long-term downtrend line, which marks the same price area. Notice that the 20-Day line and trendline have joined together. This should lead to a rejection of price to the upside, but there are no signs of it yet.
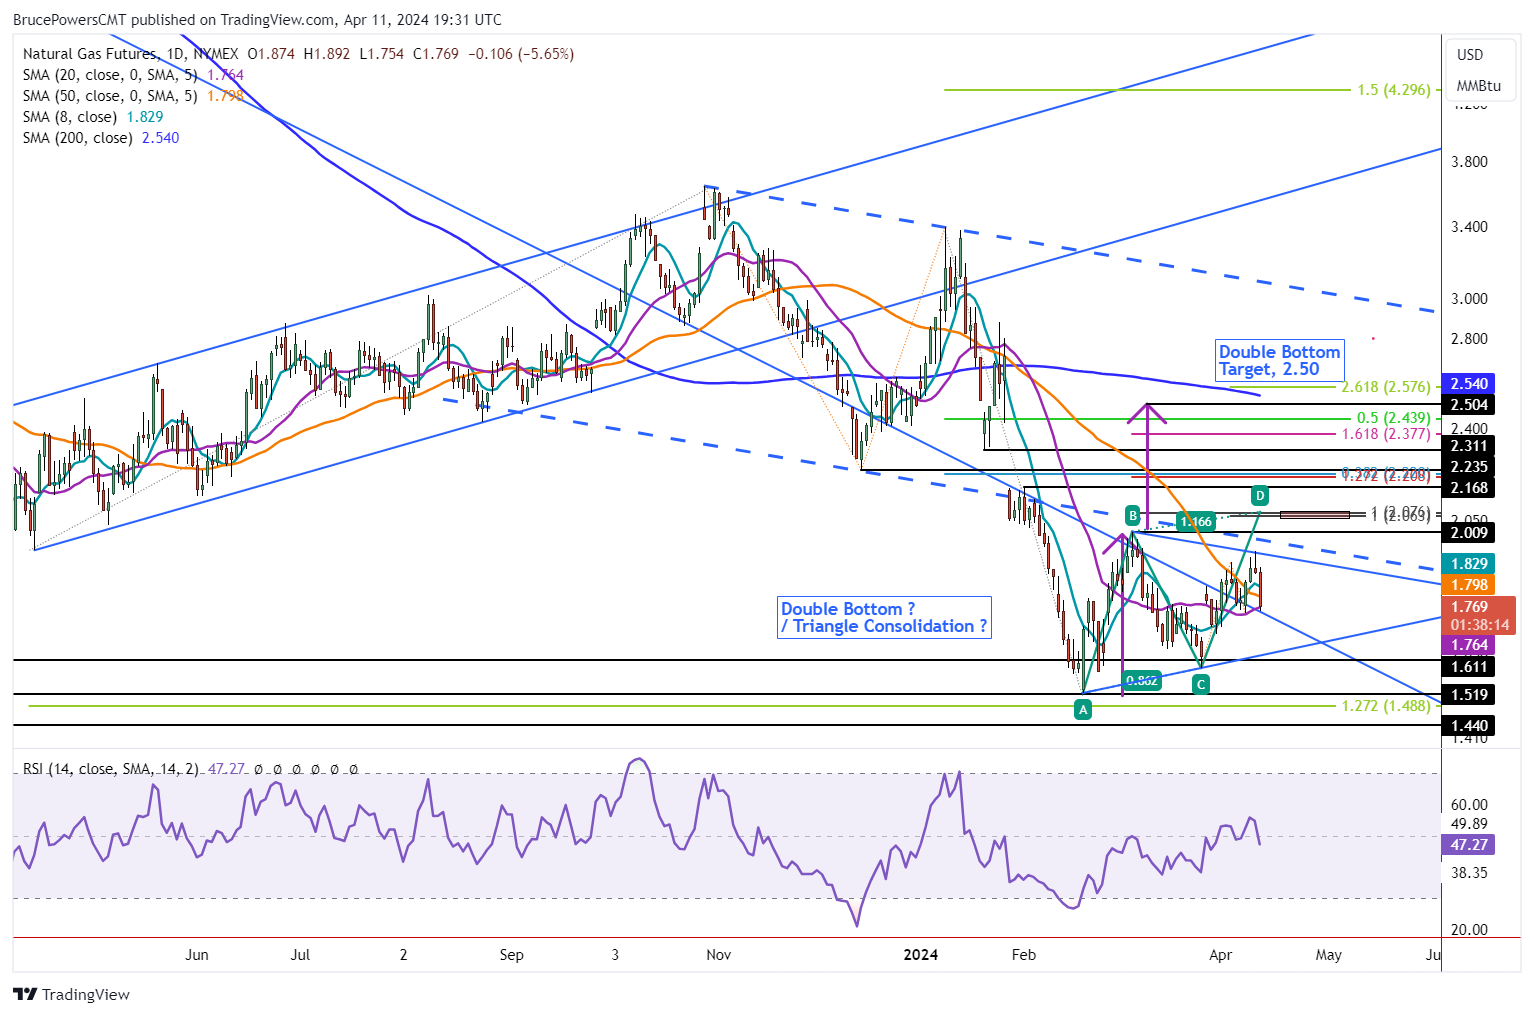
Moving Averages Show Improving Strength
Natural gas rallied back above the 20-Day line on April 1, and there was one subsequent successful test of support at the 20-Day MA. Today provides the second such test. A bounce and bullish reversal off the 1.76 price zone should complete the test and clear the way for natural gas to continue to advance. Over the past week the 8-Day MA has risen back above both the 20-Day and 50-Day MAs. And there was recently a higher swing low (C), reflecting improving demand.
Further Consolidation Possible Until Clear Breakout
Nevertheless, there is also a possibility that natural gas traces out a consolidation pattern. A bearish pennant or symmetrical triangle is the form now taking shape. It remains valid until there is an upside breakout above Wednesday’s high of 1.87. A drop below Monday’s low of 1.75 will increase the likelihood that consolidation may continue.
Rise Above 1.89 Shows Strength
Near-term resistance is now at today’s high of 1.89. A breakout above that high will provide the next sign of strength that could lead to a breakout above Wednesday’s high of 1.94. Once there is a daily close above that level natural gas should be ready to progress higher. The neckline for a potential double bottom bullish pattern is at 2.01 (B), with the first higher target zone around 2.06 to 2.08. Other target areas of interest are marked on the chart.
Weekly Chart, Bullish Signs
The weekly chart (not shown) is not a screaming buy, but it does show bullish progression. Last week’s close was relatively weak as it was in the lower half of the week’s trading range. Further, this week’s performance is also at risk of closing in the lower half of the week’s range. At the same time, this week’s low and last week’s both found support around the 8-Week MA, now at 1.73.
Read Full Story »»»
DiscoverGold
Coffee Hits All-Time High
By: Barchart | April 11, 2024
• Coffee Hits All-Time High.

Read Full Story »»»
DiscoverGold
The Corn & Ethanol Report
By: Daniel Flynn | April 11, 2024
We kickoff the day with Export Sales, PPI MoM & YoY, Core PPI MoM & YoY, PPI, Initial Jobless Claims, Continuing Jobless Claims, Jobless Claims 4-Week Average, PPI Ex Food, Energy, and Trade, and PPI Ex Food, Energy, and Trade MoM & YoY at 7:30 A.M., Fed Williams Speech at 745 A.M., EIA Natural Gas Storage at 9:30 A.M., 4-Week & 8-Week Bill Auction at 10:30 A.M., Crop Production, USDA Supply/Demand, WASDE, Fed Collins Speech, and 15 & 30-Year Mortgage Rate at 11:00 A.M., 30-Year Bond Auction at 12:00 P.M., and Fed Bostic Speech at 12:30 P.M.
With Crop production, USDA Supply/Demand WASDE and CONAB data match up the PPI and Jobless Claims should steel the show. After the morning inflation numbers as we digest the numbers we will see if those numbers put a wrinkle in the April grain reports. There are reports of the FED sounding more hawkish as inflation is taking its toll with the working class and there will be consequences at the ballot box, especially if there is no end in sight. Pre-report long term fundamentals, featuring Ukrainian corn priced to sell. US competitive with South America through summer. Ukraine’s war, freight and insurance cost challenges have kept fob premiums there deflated, which has allowed the Ukraine to capture market share in E Asia. Including China. Otherwise, unlike recent years, US Gulf corn at $490/Bu is not expensive in the world marketplace. Export Sales stay elevated relative to last year into June & July. Spot Argentine fob basis has rallied to $.70 over May CBOT. Brazilian corn isn’t quoted prior to July. US corn for delivery is offer $.12/Bu below Brazilian and at parity with Argen tin when all fobbing costs are added. This is much different than summer 2022 and 2023, when US corn was the high cost origin – due to tight stocks. A year ago April forward Brazilian offers were a full $.90-100/Bu below US Gulf origin! An outright collapse in US export demand is unlikely. Add disease pressures on Argentine corn is knifing production. Traders are waiting and will focus on South American crop sizes and the disparity between CONAB & WASDE data. Most expect a bearish US and world balance sheet. The Brazilian number holds the key, while Argentine disease concerns may lurk in their expected overall good to excellent growing year.
Read Full Story »»»
DiscoverGold
Commodity price changes over last yr
By: Charlie Bilello | April 11, 2024
• Commodity price changes over last yr
Cocoa: +245%
Gold: +17%
Coffee: +16%
Silver: +13%
WTI Crude: +8%
Copper: +8%
Brent Crude: +7%
Aluminum: +6%
US CPI: +3.5%
Cotton: +3%
Heating Oil: +1%
Zinc: -2%
Gasoline: -2%
Sugar: -9%
Natural Gas: -13%
Wheat: -18%
Soybeans: -22%
Corn: -34%
Read Full Story »»»
DiscoverGold
Weighty Decisions. The Energy Report
By: Phil Flynn | April 11, 2024
Global oil markets must decide whether they are more worried about inflation or global conflict. Oil prices fluctuated on the prospect of a widening war with new potential battlefronts in the Middle East, the ongoing war between Russia and Ukraine and surging inflation that could delay or indefinitely postpone interest rate cuts. monitoring amid ongoing uncertainties to ensure a sound and sustainable oil market balance they also are keeping their demand growth forecast for 2024 at a very impressive 2.25 million barrels a day, The stakes are getting higher every day with lives, and sacred fortunes on the line.
The Consumer Price Index was a blow to those sacred fortunes and those trying to live paycheck to paycheck or those migrant debit cards. The consumer-price index, a measure of goods and services prices across the economy, rose 3.5% in March from a year earlier, the Labor Department said Wednesday. That was a touch higher than economists had forecasted and a pickup from February’s 3.2%. The so-called core prices, which exclude volatile food and energy categories, also rose more than expected on a monthly and annual basis according to the Wall Street Journal.
That hot inflation report took the odds of a June rate cut from better than 50% down to the low 20s. The reason for this hot inflation number is very simply corporate greed. How do I know that? Very Simply, Joe Biden said so. Biden urged, “corporations including grocery retailers to use record profits to reduce prices.” As corporations should know that they should be beholden to the Biden administration and not their shareholders. That is why he wants to tax them more so he can use that money to win favor with a student who can’t or refuse to pay back their loans or others that he thinks might vote democrat. So, don’t you listen to all the economists who try to tell you that inflation is caused by the government printing too much money or running up massive historic debt levels because Biden knows better? It seems that based on when Biden got elected it brought in a new era of greed! When President Trump was in office, corporations were not greedy because inflation was at historically low levels.
Of course, you can whine about not having enough money to buy groceries or fill your gas tank or weighty decisions about what you have to put back on the shelf that was in your grocery cart but that is because you don’t understand how good you have it under Biden. Remember he called out those companies that makes your potato chip bag smaller. Maybe that’ll make your waistline shrink a little too! So, to think you’re not better off just because your monthly bills are well above your wage increases, it is just because you have been psychologically damaged. Most likely due to climate change fears. And we all know that was President Donald Trump’s fault.
Even after the hot inflation number, oil tried to hold its ground even with an Energy Information Administration (EIA) report that was bearish on the surface. Yet thoughts about inflation or the volatility of the Weekly EIA were put aside on reports that an attack on Israel by Iranian proxies was imminent according to the United States. Reuters wrote that, “Oil prices settled up $1 on Wednesday after three sons of a Hamas leader were killed in an Israeli airstrike in the Gaza Strip, feeding worries that ceasefire talks might stall.”
The market had other concerns as to whether or not the United States would back Israel in a confrontation with Iran. Some people are suggesting that the Biden administration is emboldening Iran because there is this perception that the United States will not stand with Israel if Iran attacks. The flip side of that is the Biden administration seems to be walking a fine line between saying that they will defend Israel but at the same time trying to appease their base suggesting that they might not if they don’t approve a ceasefire in the Gaza Strip.
Israeli Prime Minister Netanyahu is saying that, “we are preparing for scenarios and challenges from other fields in other words getting ready to fight a war on many fronts. This comes as the Iranian Revolutionary Guard is bragging that they could shut down the Strait of Hormuz, the world’s most important oil chokepoint. This comes as Iranian-backed Houthi rebels are already causing havoc in the Red Sea transit routes. The attempt to shut these oil flows down could lead to an incredible price spike.
While the global oil price spreads are pricing in a very undersupplied market, the EIA is giving us a little reprieve in a weekly report that may be exaggerated due to the Easter Holiday. The EIA reported that oil supplies increased by a surprising 6.4 million barrels as U.S. oil exports plummeted to 2,708 million barrels a day from 4,022 million barrels a day in the holiday-shortened week. Week-over-week drops and demand was likely impacted by the holiday. Total Petroleum demand fell from 9,236 million barrels a day to 21,292 million barrels a day a drop of 2,056 Million barrels a day
Now overnight oil prices are pulling back as well as products as the imminent talk of a threat of an attack haven’t happened just yet. Traders may also be booking profits ahead of the producer price index which if it comes in hotter like the CPI did, it could cause the dollar to rally and put downward pressure on prices. I guess we have to wait to see how greedy corporate America is gonna be this week.
Today we get the natural gas inventories we’re looking for a small injection in the supply of about 11 to 14 BCF. The market does look like it’s trying to bottom here and it still is facing some incredible headwinds but production is starting to taper off.
Read Full Story »»»
DiscoverGold
Natural Gas Hits New Trend High and Pulls Back
By: Bruce Powers | April 10, 2024
• Natural gas triggered a new trend high today but could got turned around after encountering resistance at 1.94.
Natural gas continued its advance on Wednesday with a new minor trend high of 1.94. Although Tuesday’s closing price relative to the day’s range was not particularly strong, it did manage to close at its highest daily closing price in 23 trading days. Today’s advance was hit with selling pressure once the 1.94 high was reached. At the time of this writing natural gas is trading near the lows of the day and set to close relatively weak, in the lower quarter of the day’s range.
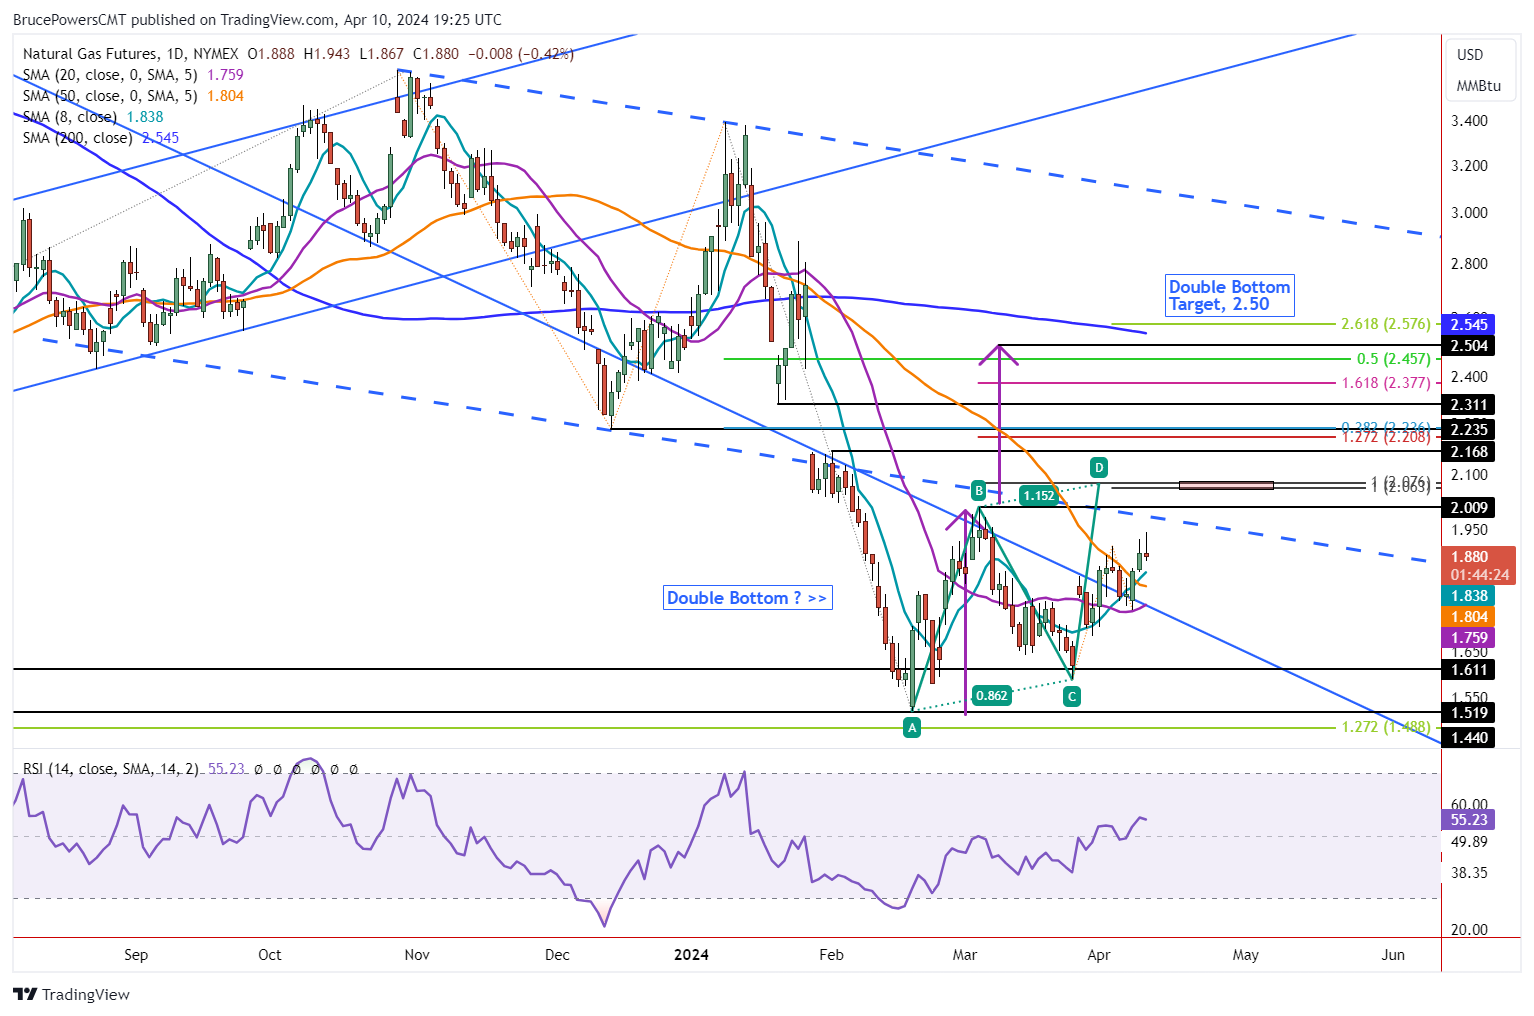
New Bullish Indications
Nonetheless, there are recent bullish indications showing underlying strength in the price of natural gas. The blue 8-Day MA has crossed up above the orange 50-Day and prior peak of the current short-term uptrend was exceeded yesterday. In addition, natural gas is holding above the 50-Day MA and above the long-term downtrend line. Support around the 50-Day line, currently at 1.80, should maintain support during weakness for recent bullish indications to remain valid.
Support Levels
The downtrend line can be priced currently because it has converged with the purple 20-Day moving average, now at 1.76. That is a more critical price area where support should be seen for the near-term bullish outlook to be retained. Given the potential for a weak close today, there is a possibility a pullback towards support may have already begone. However, it seems likely that it should be short lived if the growing bullish sentiment is to remain in charge.
Buyers Back in Charge Above 1.94
Further strength is signaled on a breakout above today’s high of 1.94. There is an initial target zone highlighted on the chart from 2.06 to 2.08. That price zone marks the completion of two rising ABCD patterns. The larger pattern is shown in green and labeled, while the smaller pattern is not labeled and starts from the most recent swing low at (C). Having such a fractal relationship between the two pieces of the developing uptrend should increase the chance for the targets to be reached. Also, a breakout above that price zone should also be met with enthusiasm from buyers.
Read Full Story »»»
DiscoverGold
Some commodity indices are up over 15% from their Q4 lows, too, suggesting that the inflation story is far from over.
By: Markets & Mayhem | April 10, 2024
• Some commodity indices are up over 15% from their Q4 lows, too, suggesting that the inflation story is far from over.
Read Full Story »»»
DiscoverGold
Agriculture Master Report
By: Bill Moore | April 10, 2024
JULY CORN
As is evident from the above chart, May Corn has been confined to a 30 cent range (420-450) since Mar 1! The friendly news such as the 3-28-24 Stocks/Seeding Report with an acres estimate 4.6 million acres less than 2023 & positive weekly export inspections & sales push the mkt up towards the top end & negative news such as planting pressure & rains for the dry areas pressure the mkt down to the 420 support! This week is another with sparse fresh news – as the mkt anticipates the onset of active planting after mid-April & the USDA April WASDE REPORT due out at 11am on Thur 4-11-24! Until then, the mkt will continue to chop around as traders “even up” in front of the report!
JULY BEANS
July Beans – much like its sister mkt July Corn – is range-bound (1185-1230) amid lackluster trade – as the mkt awaits updates from the USDA & CONAD on Thursday morning! Planting weather has been benign but some areas have been subject to flooding! Most producers seed corn first – with the wheels expected to roll in the 2nd half of April! Export interest has been meager but has been offset by strong domestic biodiesel demand! The fund short position is still sizeable – & the mkt is nearly $3.00 off its 2023 highs – so there is little margin for error for the US crops this Summer & Fall! South American production continues to ratchet down!
JULY WHT
July Wht has been slowly grinding higher since early Mar – occasionally buoyed by geopolitical issues from the escalating Russian-Ukraine War & dryness in the US Southwest plains! However, sluggish exports running 11% under 2023 & a 56% Gd-Ex crop rating has kept the wraps on recent rallies! Spring Wht planting is 3% in! Just like corn & beans, wht anxiously awaits the USDA’s April WASDE on Thur at 11am!
JUNE CAT
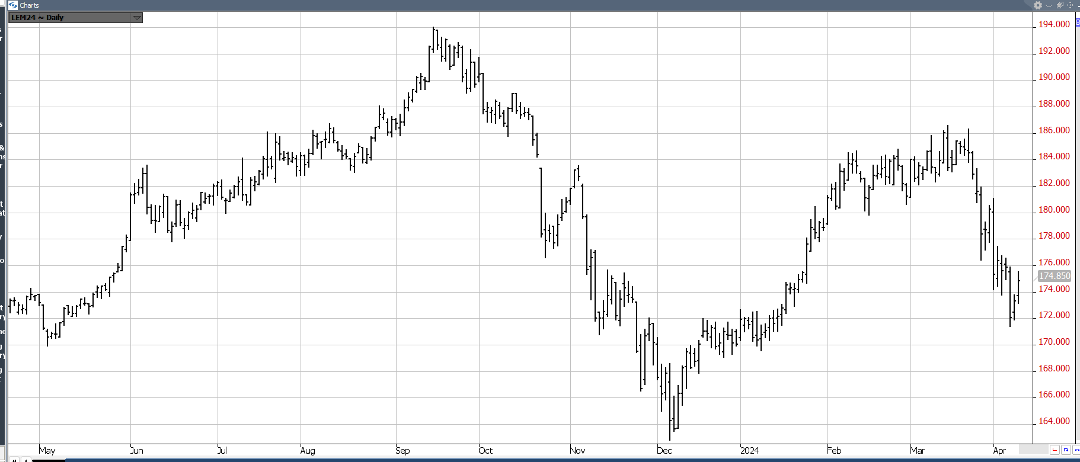
June Cattle topped out in late March – breaking $14 (186-172) due to a convergence of negatives including higher weights & slaughters, demand drying up in response to elevated prices, a bearish March Cattle-on-Feed Report – reflecting 10% more placements & finally the occurrence of Bird Flu in some dairy cattle prompting demand fears! As often happens, the break was overdone – especially as the Bird Flu news waned & the mkt recovered $5 of the plummet! The onset of the “grilling season” – the meats best demand period – will help stabilize June Cattle & cause them to consolidate well off their recent lows!
JUNE HOGS
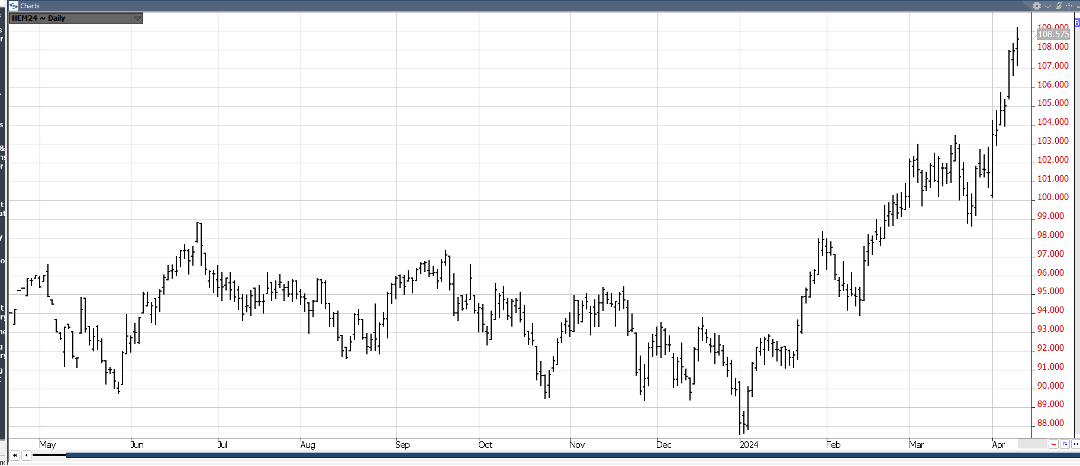
June Hogs unabashedly took over the “upside leadership role” in the meats by staging a remarkable, meteoric $9 rally (100-109) since Mar 1 – including 7 consecutive higher closes! The move was spawned by several positives – a bullishly construed Pig Crop Report on Mar 28 where Farrowing Intentions implied lower supplies, a bird flu epidemic which transferred some demand from suspect beef to much cheaper pork & finally the advent of the best demand season of the year – when everyone pulls out their grills! However, the mkt has rallied into “overbought territory” -accumulating a big premium to cash – & is due for a correction soon!
Read Full Story »»»
DiscoverGold
War Torn Super Cycle. The Energy Report
By: Phil Flynn | April 10, 2024
The Commodity Supercycle that seemed dormant late last year has awakened, incredibly. While many thought that the cycle had passed, it is clear now that price respite was just the eye of the commodity prices super cycle hurricane. The historic record-breaking price surge that we have seen in cocoa may be a preview of what we may see in other commodities where it appears demand will outstrip supply. Commodities like copper, silver, platinum, palladium, and of course the world’s black gold, oil that Texas tea, are headed for supply squeezes unlike anything we have seen since the 1970s and it did not happen overnight. It happened while the world was sleeping.
Underinvestment in fossil fuels as well as a hostile regulatory environment, means global oil supplies are going to be short. Even the Energy Information Administration in their recent short-term energy outlook not only had to raise the oil prices but also had to adjust their downward projections of future demand in an attempt to perhaps justify their previous massive adjustments to their numbers. In other words, the EIA had to raise their demand forecasts before they could lower it. The EIA raised their forecast of WTI crude prices to average $83.78/ barrel(bbl) in 2024, versus an earlier forecast of $82.15/bbl. The EIA also raised its Brent Crude prices to an average of $86.98/bbl in 2025, versus an earlier forecast of $84.80/bbl. Yet it was demand where they had to raise the river instead of lowering the bridge to make their forecast jive.
Or as the EIA put it, “This month we revised the 2022 global liquid fuels consumption data available in our International Energy Statistics, increasing our assessment of global oil consumption that year by nearly 0.8 million barrels per day (b/d) compared to last month’s STEO. The historical data serves as a baseline for our short-term forecasts, affecting our view of energy markets this year and next. This month’s revision to historic data, as well as current market dynamics, led us to increase our forecasts for global oil consumption.” Yet if you want to be confused, then they go on to say that after the adjustment the EIA cuts forecast for 2024 world oil demand growth by 480,000 bpd, now sees 0.95 mln bpd year-on-year increase. And cuts forecast for 2025 world oil demand growth by 30,000 bpd, now sees 1.35 mln bpd year on year increase.” Are they trying to hide their meaning here?
What they won’t be able to hide is rising gasoline prices. The EIA raised its forecast for retail gasoline prices in 2024 to $3.59 a gallon, versus an earlier forecast of $3.48 a gallon.
Yesterday the market was reluctant to move higher as it tried to digest headlines surrounding geopolitical risk that could have major implications for the price of oil and the potential movement for oil. Last week oil put in a lot of risk premium on the expectations that Iran would respond directly against Israel after the attack on its compound in Lebanon. Yesterday there was an unconfirmed report that an Iranian envoy was en route to the United States for some talks to avoid a conflict and made the rounds even though the story wasn’t confirmed.
Another headline that took out some more premium was the report that the US Defense Secretary heard from Israel that there is no set date for its invasion of Rafah, raising hopes that there could be some hope for a ceasefire even if a ceasefire talks broke down. That was after Prime Minister Benjamin Netanyahu said Monday that he has set a date for the IDF to launch its much-anticipated offensive in the southern Gaza city of Rafah. All of this is happening and swaying the market.
Now the American Petroleum Institute (API)report seemed to suggest that supplies from the seasonal viewpoint are very tight but based on weekly numbers are less than inspiring to the bullish side of the market.
The API reported the crude supplies increased by 3.034 million barrels which was more than the market had anticipated but from a seasonal viewpoint smaller than most builds at this time of year. Gasoline inventories fell by 609,000 barrels and distillates rose by 120,000 barrels which wasn’t that inspiring to either the bulls or the bear. The products have been under pressure. This week’s report, if confirmed today by the Energy Information Administration report, could give us the bottom for the products.
Yet what may be important to the oil and product traders today will be the consumer price index. The market fixation on whether or not the Federal Reserve is going to have the ability to cut interest rates as inflation continues to be strong is the question on most traders minds. The key thing here is that even if the Federal Reserve has to backtrack on a rate cutting, the reality is it won’t impact oil demand quickly enough to save the market from a supply squeeze.
What we expect is that oil will react to a hot or cold report in the long run. It’ll be the supply deficit that will keep support under this market. Remember all that talk about peak oil supply and then the switch over to peak oil demand? Well apparently in the big picture neither one of those predictions is correct. There is a new report by Enverus Intelligence Research that expects global oil demand will grow by 108 million barrels a day by 2030 and will not see peak demand at the end of the decade. The quiet little secret known by many people in the oil industry is simply this: the predictions of peak oil demand were greatly exaggerated.
Speaking about being greatly exaggerated, did you know that Treasury Secretary Janet Yellen is trying to tell people that she believes that the Russian price caps worked? I’m not kidding you. My good friend and noted oil analyst Anas Alhajji said, “Yellen’s price caps on Russian oil are a joke and have no impact. Attacks on Russian refineries meant more crude to export. Here is what Argus wrote today: “Russian crude production rose by 30,000 b/d to 9.44mn b/d, just 10,000 b/d shy of its target. Drone attacks have damaged over 800,000 b/d of Russian refining capacity in recent months, freeing up more crude for export — shipments hit an 11-month high in March.” Take that, Vladimir. Now let’s talk about those so-called sanctions on Iran that have given them billions of dollars. Never mind…I am running out of time.
Let’s move on to natural gas quickly. Reports that Freeport is going to get back online a month earlier than expected and more capacity coming online for LNG exports is giving us a ray of hope that maybe the bottom is in for natural gas. What’s interesting to note is the Energy Information Administration pointed out that for the first time in history, the cost of natural gas is lower than coal. This should be incredible news for people who are concerned about greenhouse gas emissions. The United States is the biggest producer of natural gas and we can change the world by providing cheap natural gas to replace coal plants thereby reducing greenhouse gas emissions. Incredibly this comes even as the Biden administration plays politics with projects surrounding LNG exports.
In yesterday’s Short-Term Energy Outlook, the EIA reported that, “The U.S. winter natural gas withdrawal season ended with 39% more natural gas in storage compared with the five-year average. From April through October this year, EIA forecast less natural gas will be injected into storage than is typical, largely because we expect the United States will produce less natural gas on average in 2Q24 and 3Q24 compared with 1Q24. Despite lower production, EIA still expects the United States will have the most natural gas in storage on record when the winter withdrawal season begins in November. As a result of high inventories, we expect the Henry Hub spot price to average less than $2.00 per million British thermal units (MMBtu) in 2Q24 before increasing slightly in 3Q24. EIA forecast for all of 2024 averages about $2.20/MMBtu.
Read Full Story »»»
DiscoverGold
The Corn & Ethanol Report
By: Daniel Flynn | April 10, 2024
We kickoff the day with MBA 30-Year Mortgage Rate, MBA Mortgage Applications, MBA Mortgage Market Index, MBA Mortgage Refinance Index, and MBA Purchase Index at 6:00 A.M., Core Inflation Rate MoM & YoY, Inflation Rate MoM & YoY, CPI, and CPI sa at 7:30 A.M., Fed Bowman Speech at 7:45 A.M., Wholesale Inventories at 9:00 A.M., API Energy Stocks at 9:30 A.M., 17-Week Bill Auction at 10:30 A.M., Fed Goolsbee Speech at 11:45 A.M., 10-Year Note Auction at 12:00 P.M., FOMC Minutes and Monthly Budget Statement at 1:00 P.M., and Dairy Products Sales at 2:00 P.M.
Welcome to the 1st day of 2024, when most Midwest farmers can seed corn under the revenue insurance rules. April 10th is often is the 1st day of spring in which wide spread Midwest corn seeding can commence – and weather and soil moisture permitting, from this day forward Midwest farmers will become more active in seeding spring crops. USDA, Brazil CONAB and WASDE will release their April crop estimates tomorrow. Garnering keen attention will be the size of the ’24 Brazilian corn/soybean crops. In March there was an 8.2 MMT’s spread between CONAB and WASDE soybean crop estimates which has a sizable impact on 2-24/25 US soybean export forecasts. It’s the direction of the WASDE Brazilian soybean/corn estimates which key the post report reaction tomorrow. Choppy grain action has prevailed since late February when longer term market lows were scored. Brazil has harvested more than 80% of its soybean crop while world wheat prices are turning upwards. The April USDA reports are unlikely to end the bull & bear debate on South American crop sizes. However, Brazilian soybean fob offers at Paranaqua are rising and positive through August at $.40/Bu over. A year ago, for May shipment Paranaqua soybeans were offered at $1.45 under today’s $.05 over – a big $1.50/Bu difference! As I mentioned before, I expect choppy trade as the bulls & bears duke it out with managed funds reshuffling their large net short position.
Read Full Story »»»
DiscoverGold
Natural Gas Moving Average Breakout Improves Bullish Outlook
By: Bruce Powers | April 9, 2024
• Natural gas showed strength by closing above its 50-Day MA, signaling potential demand increase.
Natural gas closed above its 50-Day MA for the first time since mid-January on Monday. That is a sign of strength that should see demand increase in the coming days. A teaser occurred today as natural gas rallied above the recent 1.91 minor swing high before encountering resistance at the day’s high of 1.92. An intraday selloff followed back to the lows of the day. Where it closes relative to the day’s range should provide a clue as to current sentiment.
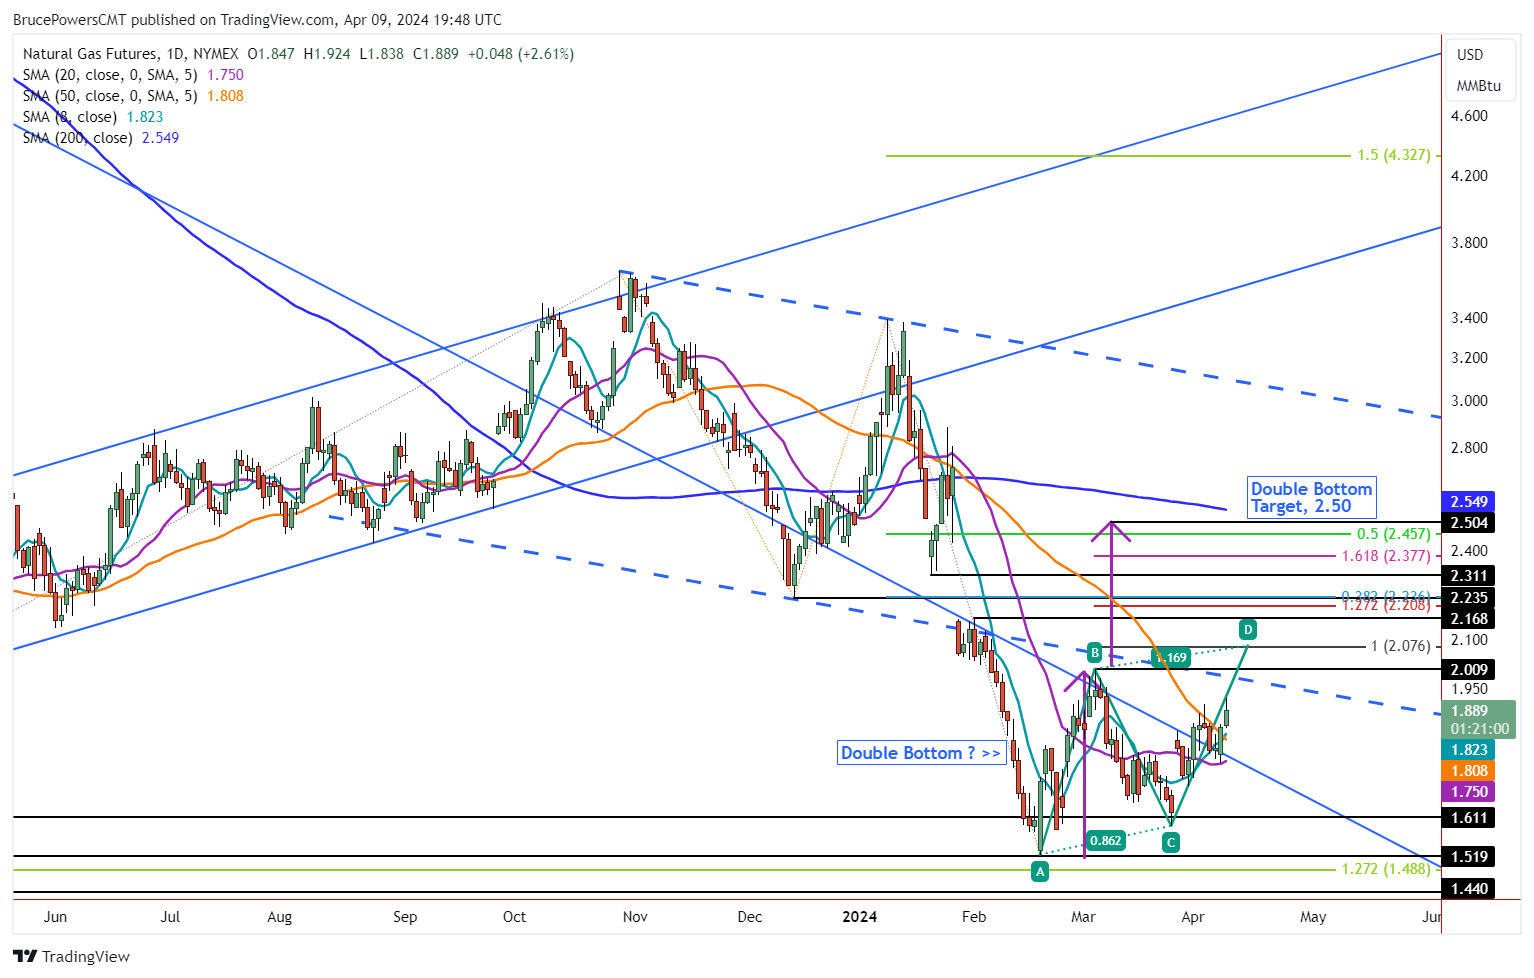
Advance Continues Following 50-Day MA Breakout
There was minor confirmation of strength since the breakout above the 50-Day MA, as the 8-Day MA crossed above the 50-Day today for the first time since mid-January, today. Also, yesterday the 20-Day MA was successfully tested as support for the first time since the price of natural gas rallied back above the 20-Day line on April 1.
That cleared the way for further strengthening, which we saw yesterday and then again today. What happens next will be key though as a failed breakout is always possible. A second daily close above the 50-Day line today would dampen that possibility. Then, we need to see signs of further strengthening if natural gas is going to have a chance at reaching higher targets.
Potential Double Bottom Setup
A rally above the 2.01 (B) swing high will trigger a breakout of a double bottom bullish reversal pattern and a continuation of the current developing uptrend. At that point there would be a higher swing high that would follow the recent higher swing low (C). The first identified target from current levels is the completion of a small rising ABCD pattern at 2.08.
At that price the CD leg of the advance will match the price appreciation seen in the first leg up, marked A to B. Once there is price symmetry a potential resistance zone has been reached. There are also interim price targets on the way up to the double bottom target of 2.50.
Higher Targets
The consolidation high following the large gap down in late-January is at 2.17. However, the more notable 38.2% Fibonacci retracement level is at 2.24. That price level takes on a somewhat greater significance since it is also match with prior support at the December swing low.
Read Full Story »»»
DiscoverGold
Softs Report: Cotton, OJ, Coffee, Sugar, Cocoa
By: Jack Scoville | April 9, 2024
• COTTON
General Comments: Cotton was mixed yesterday, with nearby prices a little higher and deferred months a little lower. Trends are still down on the daily and weekly charts on concerns about the planting intentions report released a week ago and despite improving ideas of demand potential from China. Demand has been weaker so far this year. USDA said that 10.7 on acres might get planted this year, from 10.2 million last year. It is too early to plant in Texas but the heat and dry weather raises concerns about production potential later in the growing season and blackened soils might not permit much planting, anyway. The demand news has been reduced from previous levels in this market for the last several weeks. The US economic data has been positive, but the Chinese economic data has not been real positive and demand concerns are still around. However, Chinese consumer demand has held together well, leading some to think that demand for Cotton in world markets will increase over time.
Overnight News: The Delta will get showers and rains and near normal temperatures. The Southeast will see showers and rains and near normal temperatures. Texas will have mostly dry conditions and near normal temperatures. USDA said that Cotton is now 5% planted, from 3% last week, 5% last year, and 6% average.
Chart Trends: Trends in Cotton are down with objectives of 86.00, 83.20, and 77.20 May. Support is at 86.10, 85.60, and 82.90 May, with resistance of 91.30, 92.90 and 94.30 May.
• FCOJ
General Comments: FCOJ closed lower yesterday and remains in a trading range. Reports of tight supplies are around. Florida said that Oranges production will be low, but above a year ago. Futures still appear to have topped out even with no real downtrend showing yet, so a range trade has been seen. Prices had been moving lower on the increased production potential for Florida and the US and in Brazil but is now holding as current supplies remain very tight amid only incremental relief for supplies is forecast for the coming new crop season. There are no weather concerns to speak of for Florida or for Brazil right now. The weather has improved in Brazil with some moderation in temperatures and increased rainfall amid reports of short supplies in Florida and Brazil are around but will start to disappear as the weather improves and the new crop gets harvested.
Overnight News: Florida should get scattered showers or dry conditions. Temperatures will average near normal. Brazil should get scattered showers and above normal temperatures.
Chart Trends: Trends in FCOJ are mixed. Support is at 350.00, 347.00, and 353.00 May, with resistance at 378.00, 389.00, and 391.00 May.
• COFFEE
General Comments: New York closed a little lower and London was mixed to higher and both show up trends on the daily and weekly charts. Trading was quiet. The lack of Robusta Coffee in the market continues to support futures. Robusta offers from Vietnam remain difficult to find and the lack of offer of Robusta is a bullish force behind the London market action. There were some indications that Vietnam producers were now offering a little Coffee, but not much and not nearly enough to satisfy demand. Vietnamese producers are reported to have about a quarter of the crop left to sell or less and reports indicate that Brazil producers are reluctant sellers for now after selling a lot earlier in the year. The next Robusta harvest in Brazil will start next month. Brazil weather continues to improve for Coffee production and conditions are called good.
Overnight News: The ICO daily average price is now 205.50 ct/lb. Brazil will get mostly scattered showers with near normal temperatures. Central America will get mostly dry conditions. Vietnam will see scattered showers
Chart Trends: Trends in New York are up with no objectives. Support is at 208.00, 201.00, and 195.00 May, and resistance is at 213.00, 216.00 and 219.00 May. Trends in London are up with no objectives. Support is at 3600, 3480, and 3360 May, with resistance at 3830, 3860, and 3890 May.
• SUGAR
General Comments: New York and London closed lower yesterday on ideas that the Brazil harvest can be strong for the next few weeks if not longer. Indian production estimates are creeping higher but are still reduced from recent years. There are worries about the Thai and Indian production. Offers from Brazil are still active but other origins. are still not offering in large amounts except for Ukraine. Ukraine offers have suffered lately with the war. Demand reports from Europe have been strong.
Overnight News: Brazil will get rains in the south and scattered showers in the north. Temperatures should average above normal. India will get mostly dry conditions and below normal temperatures.
Chart Trends: Trends in New York are mixed. Support is at 2150, 2080, and 2040 July and resistance is at 2220, 2250, and 2260 July. Trends in London are mixed. Support is at 613.00, 610.00, and 595.00 August, with resistance at 630.00, 636.00, and 647.00 August.
• COCOA
General Comments: New York was lower and London was higher yesterday and continued to consolidate the massive gains from the recent rally. A short term top is possible but far from guaranteed. Production concerns in West Africa as well as demand from nontraditional sources along with traditional buyers keep supporting futures. Production in West Africa could be reduced this year due to the extreme weather which included Harmattan conditions. The availability of Cocoa from West Africa remains very restricted and projections for another production deficit against demand for the coming year are increasing. Ideas of tight supplies remain based on more reports of reduced arrivals in Ivory Coast and Ghana continue. Ivory Coast arrivals are now 1,301 tons, down 26.7% from the previous year. Mid crop harvest is now underway and here are hopes for additional supplies for the market from the second harvest. Demand continues to be strong, especially from nontraditional buyers of Cocoa.
Overnight News: Isolated showers are forecast for West Africa. Temperatures will be near normal. Malaysia and Indonesia should see scattered showers. Temperatures should average near normal. Brazil will get isolated showers and above normal temperatures.
Chart Trends: Trends in New York are mixed. Support is at 9000, 8410, and 8730 May, with resistance at 10120, 10240, and 10360 May. Trends in London are mixed. Support is at 7500, 6860, and 6500 May, with resistance at 8690, 8840, and 8960 May.
Read Full Story »»»
DiscoverGold
Grains Report: Wheat, Rice, Corn and Oats, Soybeans, Canola and Palm Oil
By: Jack Scoville | April 9, 2024
• WHEAT
General Comments: Wheat was a little higher in slow trading with little fresh news yesterday. Trends turned up in SRW but remain mixed in HRW and Spring The USDA reports released a week ago were considered friendly. USDA said that All Wheat plantings would be about 47.5 million acres, with the big reductions seen in Winter Wheat. In contrast, Spring Wheat plantings were above the trade guesses at 11.335 million acres. Inventories were just above the average trade guess and 1.083 billion bushels. The weekly condition report a week ago showed good conditions and the weekly export sales report was poor. The problems with Russian Wheat exporters continue. The dispute has held up shipments of at least 400,000 tons of grain so far. The reports indicate that the government is seeking more control of the exports and has made life very difficult on the private exporters in an effort to extract more sales and powers to the government. Russia is the worlds largest exporter and sets the world price and prices remain low. Big world supplies and low world prices are still around. Export sales remain weak on competition from Russia, Ukraine, and the EU as those countries look to export a lot of Wheat in the coming period. Black Sea offers are still plentiful.
Overnight News: The southern Great Plains should get Scattered showers. Temperatures should be below normal. Northern areas should see scattered showers. Temperatures will average below normal. The Canadian Prairies should see scattered showers. Temperatures should average below normal.
Chart Analysis: Trends in Chicago are up with objectives of 590 and 618 May. Support is at 560, 539, and 537 May, with resistance at 575, 580, and 584 May. Trends in Kansas City are mixed. Support is at 561, 552, and 546 May, with resistance at 595, 602, and 605 May. Trends in Minneapolis are mixed. Support is at 646, 640, and 634 May, and resistance is at 660, 677, and 681 May.
• RICE
General Comments: Rice closed mixed in quiet trading yesterday. Futures turned sideways after the big move lower. Trends are mixed in this market on the daily charts. The market noted good planting and emergence progress in the weekly USDA reports released on Monday afternoon. Good demand for exports continues. The overseas markets feature less production in Brazil and India, and it appears that the lack of offer from these markets is supporting increased demand for US Rice and prices here in the US. It turning drier and warmer in the US this week and fieldwork should become active.
Overnight News:
Chart Analysis: Trends are mixed. Support is at 1602, 1588, and 1576 May and resistance is at 1670, 1704, and 1751 May.
• CORN AND OATS
General Comments: Corn and Oats closed a little higher in quiet trading as traders think that good Spring weather here will greatly increase planted Corn area. This might not be true as it is very expensive to plant Corn and Corn is considered unprofitable to plant right now. USDA issued its first crop progress report for Corn early last week. The USDA reports released more than a week ago showed inventories and planting ideas below trade expectations. Demand for Corn has been strong at lower prices. Big supplies and reports of limited demand are still around, but futures have been very oversold. Funds remain very large shorts in the market.
Overnight News:
Chart Analysis: Trends in Corn are mixed. Support is at 426, 422, and 408 May, and resistance is at 448, 459, and 463 May. Trends in Oats are mixed. Support is at 328, 322, and 316 May, and resistance is at 349, 353, and 359 May.
• SOYBEANS
General Comments: Soybeans closed a little lower and Soybean Meal closed a little higher. Soybean Oil was lower. Brazil producers had been taking advantage on higher futures in the US and higher basis levels in Brazil, but the basis has fallen sharply in Brazil this week and sales have been less. Reports of great export demand in Brazil provide some support. Reports indicate that China has been a very active buyer of Brazil Soybeans this season. Ideas that South American production is taking demand from the US have pressured futures lower. Funds remain large shorts in the market. The US reports strong domestic demand.
Overnight News:
Chart Analysis: Trends in Soybeans are mixed. Support is at 1165, 1153, and 1140 May, and resistance is at 1207, 1211, and 1217 May. Trends in Soybean Meal are mixed. Support is at 323.00, 320.00, and 317.00 May, and resistance is at 340.00, 348.00, and 352.00 May. Trends in Soybean Oil are mixed. Support is at 4730, 4690, and 4640 May, with resistance at 4980, 5000, and 5030 May.
• CANOLA AND PALM OIL
General Comments: Palm Oil was lower yesterday on profit taking but found support from strong export data for the month from private sources. It was higher today n strong exports and rallies in the Crude Oil futures. The export pace is expected to continue to really improve but this is part of the price already, in part due to stronger world petroleum prices that have affected world vegetable oils prices as well. Domestic biofuels demand is likely to improve. Ideas of weaker production ideas against good demand still support the market overall. Trends are turning up on the daily charts. Canola was a little lower. There were reports of good growing conditions in Argentina. Current forecasts call for generally improved growing conditions in Brazil this week.
Overnight News:
Chart Analysis: Trends in Canola are mixed. Support is at 630.00, 616.00, and 610.00 May, with resistance at 645.00, 652.00, and 657.00 May. Trends in Palm Oil are up with objectives of 4460 and 4650 June. Support is at 4270, 4200, and 4130 May, with resistance at 4440, 4460, and 4490 May.
Midwest Weather Forecast Showers and storms. Temperatures should average below normal.
Read Full Story »»»
DiscoverGold
Control Freak Out. The Energy Report
By: Phil Flynn | April 9, 2024
Oil is on the rise as the headlines blast that the oil market is going to get extremely tight in the second half of the year and that OPEC has regained control of the oil market. These headlines are correct, and it is something we predicted would happen oh so long ago. These are predictions by Citadel and are being echoed by other people in the market who must face up to the fact that global demand is exceeding daily production and could by a wide margin by the end of the year. Vitol is predicting oil averages between $80 and $100 a barrel because of what they call a restrained market. The CEO of Vital, Russell Hardy, says that oil demand growth is expected to be at 1.9 mbpd this year. Also, Reuters is reporting that Mexico is cutting oil exports by at least 330,000 barrels per day in May.
Oil prices are surging after Hamas predictably rejected the terms of the ceasefire and Israeli Prime Minister Benjamin Netanyahu on Monday said Israel will be moving forward with a planned attack on the city of Rafah in the Gaza Strip. This comes as the Iranian foreign minister continues to blame the United States for approving Israel’s attack on its consulate in Syria. The attack that killed 2 Iranian generals may be a reason why Iran may still respond. Yet Iran has failed to do so, so far. Perhaps they are worried about sparking a direct conflict with Iran or the United States.
Global demand is exceeding supply as China’s manufacturing sector surges. Their domestic demand hit the highest level since pre-COVID. S&P Global reported overnight that China’s independent refineries ramped up feedstock imports by 13.3% on the month to a seven-month high of 17.4 million mt (127.54 million barrels) in March, the highest since August when it was at 18.23 million mt, S&P Global Commodity Insights data showed April 9.
The supply squeeze is on and the bearish arguments that we would not consume as much oil because we were heading into a recession or that Chinese demand was near record high would peak were incorrect.
They also said that US energy producers would continue to find ways to increase output to meet global demand would continue to happen even with the most hostile fossil fuel administration in the nation’s history. Sadly, Americans pulling up to the pump are finding out that this was not the case.
JP Morgan is reporting that U.S. oil production is starting to fall to 12.32 million barrels a day over the past week that’s down from 12.71 million barrels the prior week. Industry insiders are now saying that because of increased regulatory burdens and the lack of capital, the US energy production is going to plateau. Sufficient reasons suggested that the cancellation of the Keystone XL pipeline and drilling moratoriums, and threats of more regulations would stymie US output and cede control of the global oil market back to OPEC over the US was bound to happen.
Now there is a Washington Post article, you know that paper where their mission is to let Democracy Die In Darkness that says, “The EPA Mulls Tougher Limits On New Gas Plants As 2024 Election Nears. “The Post says, “The reconsideration comes after the Biden administration has backpedaled on other proposed climate regulations.” Yes, the ridiculous proposals were based on data that showed it cost a lot of money but did absolutely nothing to help the environment. He had to back pedal because the truth made them look ridiculous. So now to try to save face with the environmental left they have to make a splash.
The Post reports that, “The Environmental Protection Agency is considering significantly strengthening proposed limits on planet-warming pollution from power plants — a crucial part of President Biden’s climate agenda — according to three people briefed on the matter, who spoke on the condition of anonymity because no final decisions have been made.
The discussions about toughening the standards, which are set to be released this month, have major implications for America’s fleet of power plants, which rank as the country’s second-largest contributor to climate change. They come as the administration weighs the political calculus of weakening or strengthening environmental regulations before the 2024 election. The Post says, “The change could affect most new gas plants built in the United States, and it could have a significant climate impact. According to the EPA’s modeling, it could prevent up to 10.6 million metric tons of carbon emissions per year — equivalent to taking 2.5 million cars off the nation’s roads for a year.” Of course, you better check their math on that.
One of the things that we want to keep an eye on is this weakness in the crack spreads. The weakness in the crack spreads and the moves higher suggests that maybe demand could be challenged by these prices. On the flip side of that though, the other reason why we’re seeing some reluctance to move higher is concerns that the economy is too strong, and the Fed will have to cool things down. Don’t you love it when the market is confused as to whether it should be happy, the economy is strong, or it should be bearish because the economy is strong?
Oil prices are overbought but bounced back after key support test. The risk to oil is still around the upside but we have to be on guard for some corrections and some volatility.
Natural gas is starting to rebound even as we expect to see an injection this week into supply. With more talk of falling production, it is giving the natural gas market a boost.
Read Full Story »»»
DiscoverGold
Commodities Daily Market Movers (% Price Change)
By: Marty Armstrong | April 9, 2024
• Top Movers
AU - Queensland Base-Load Electricity Futures 5.72 %
Oats (Minneapolis) 5.37 %
AU - Victoria Base-Load Electricity Futures 5.34 %
NSW Baseload Electricity Continuous 4.81 %
NY Palladium Futures 4.28 %
• Bottom Movers
London IPE Gas Oil Futures 2.24 %
Soybean Oil CBT Futures 2.02 %
Palm Kernel Oil 1.91 %
Sugar World (CSCE) Futures 1.82 %
NY Heating Oil Futures 1.48 %
*Close from the last completed Daily
DiscoverGold
Natural Gas Daily Bullish Reversal Signals End to Pullback
By: Bruce Powers | April 8, 2024
• Natural gas triggered a bullish reversal on the daily chart, signaling an end to the three-day correction.
Natural gas triggered a daily bullish reversal on Monday, pointing to the likely completion of a three-day correction. Following a new pullback low of 1.75 earlier in the session and test of support at the purple 8-Day MA, also at 1.75, natural gas turned higher and broke out above Friday’s high of 1.82. A daily close above that price level will confirm the reversal and set the stage for a continuation higher.
Back Above 50-Day Moving Average
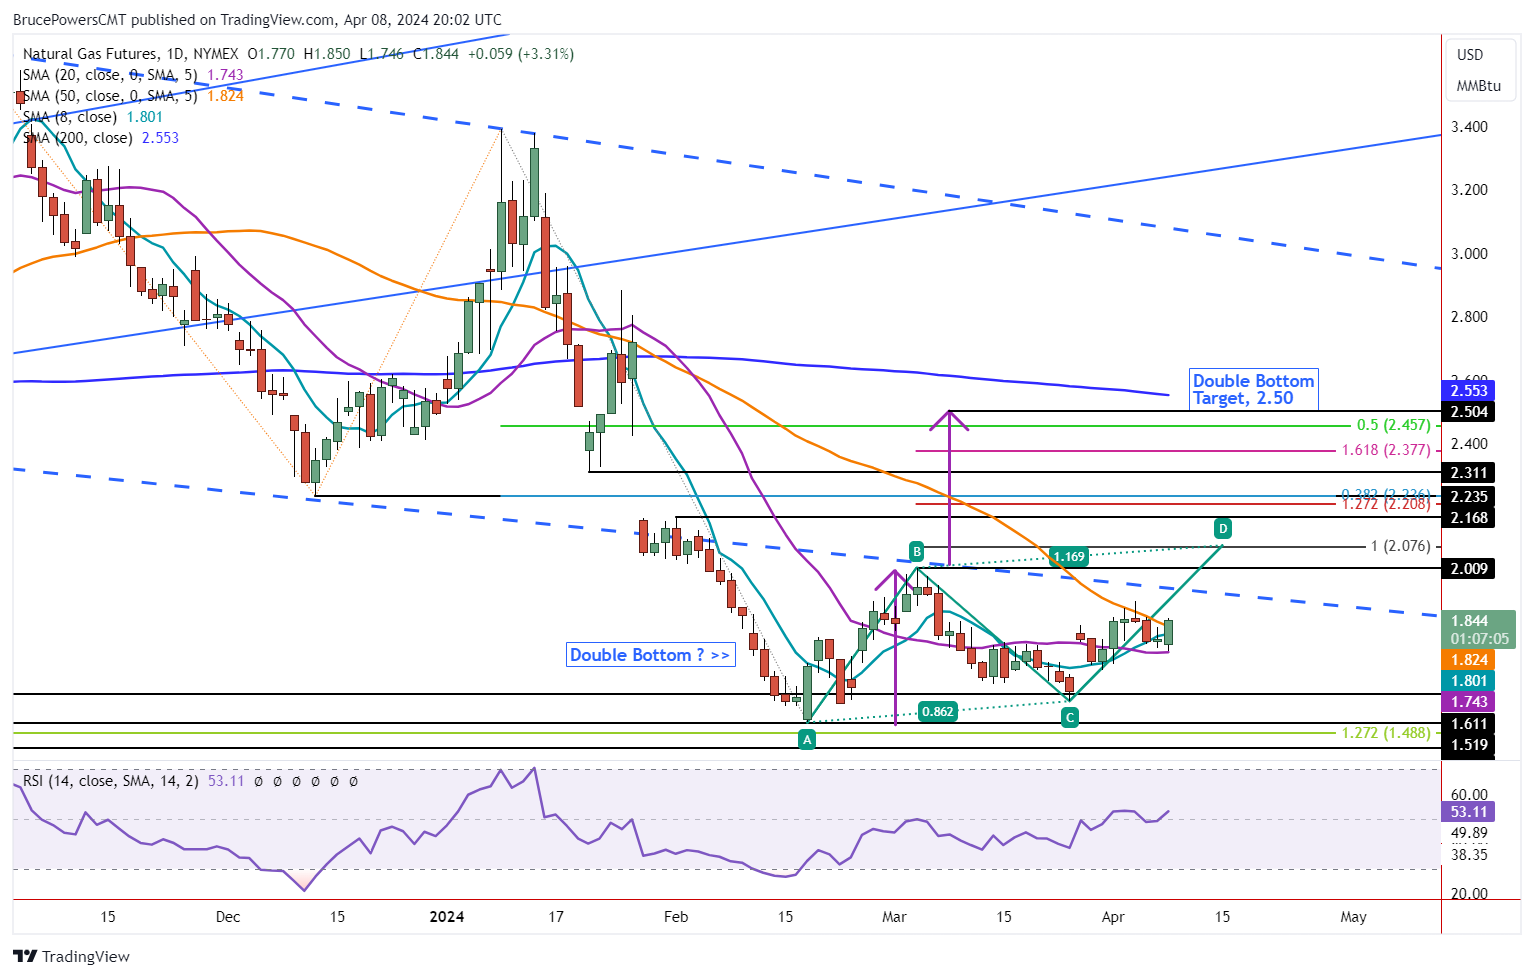
The orange 50-Day MA has marked dynamic resistance for the downtrend since mid-January. It currently stands around 1.8,2 and a daily close above it will provide a clear sign that demand for natural gas is improving. At the time of the writing, natural gas is trading above the 50-Day line. Moreover, the highest daily close since the March 25 bottom (C) was 1.85. An additional sign of strength will be indicated if natural gas can close above the 1.85 price level, which will be its highest daily close so far in the developing uptrend.
Weely Chart Shows Improvement
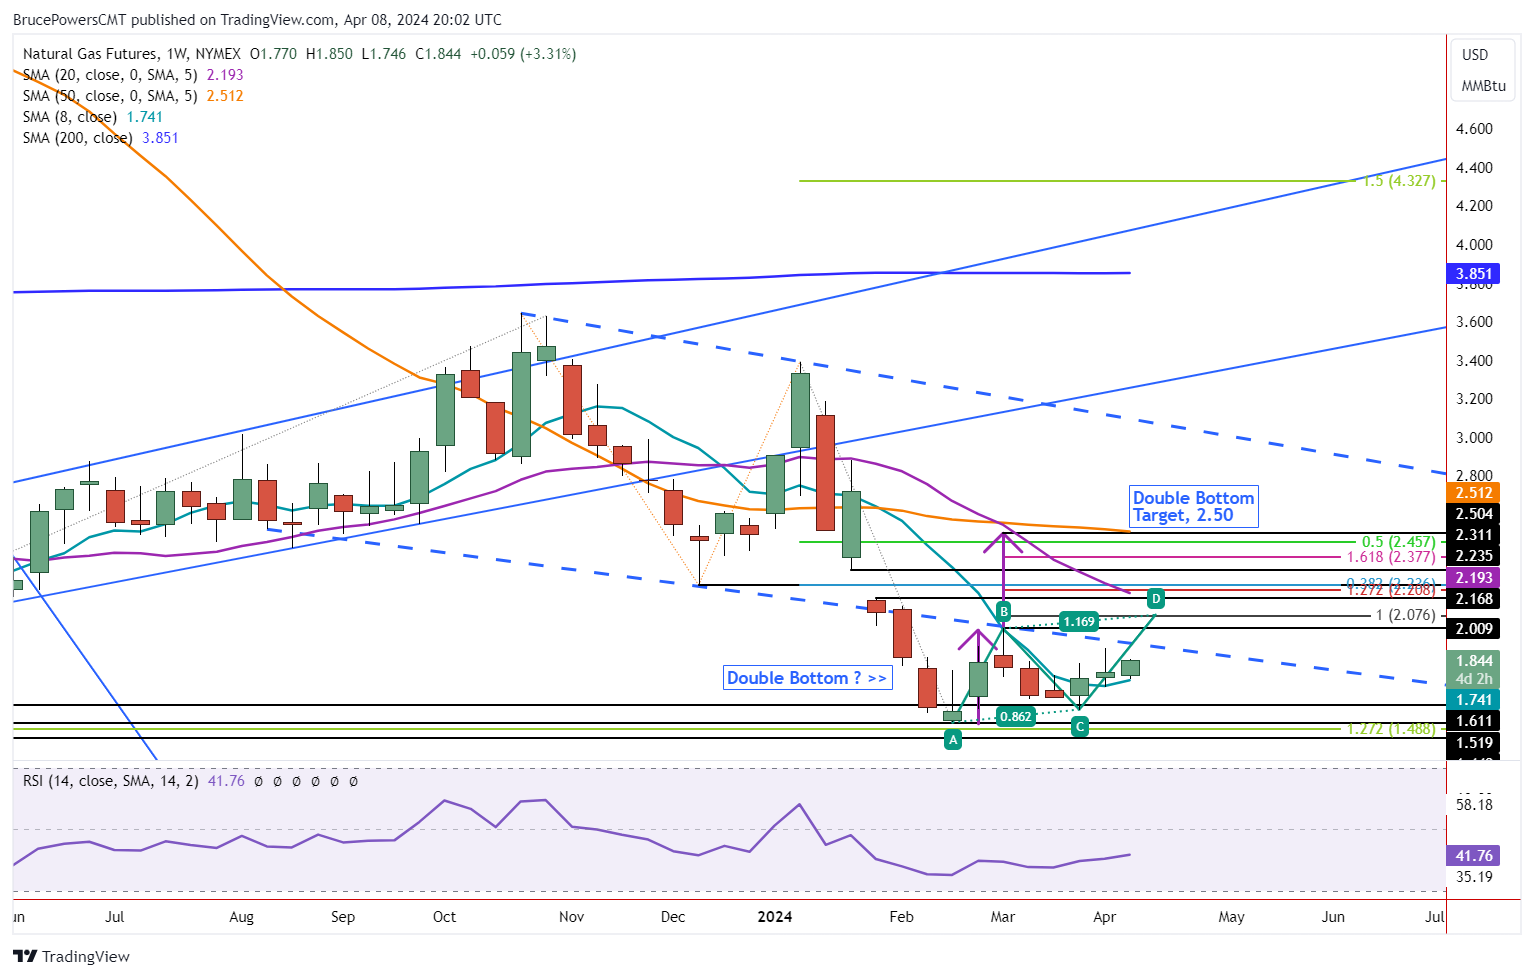
There are also bullish signs showing up on the weekly chart. A weekly bullish reversal triggered last week during a rally above the current three-week high of 1.83. It was confirmed on a daily close above the price level, but not yet on a weekly close as last week’s closing price was above the prior week’s high. Of significance, support on the weekly timeframe was seen at the 8-Week MA after the price of natural gas had traded below that line for approximately 10 weeks. Then again today, Monday, the low of the day successfully finds support around the 8-Week line.
Upside Higher Target of 2.50
If natural gas can close above the 50-Day line and continue to strengthen, it should exceed the recent minor swing high of 1.91 and trigger a continuation of the rising trend that began from the (C) point. That will put it on track to successfully engage the swing high of 2.01 at (B). A breakout above that high will trigger a bullish trend continuation of the developing trend as well as a double bottom pattern. The first upside target is then at 2.08, which will complete a rising ABCD pattern as marked on the chart. A minimum potential target from the double bottom bullish reversal pattern is up around 2.50.
Read Full Story »»»
DiscoverGold
The Pullback. The Energy Report
By: Phil Flynn | April 8, 2024
Oil is back after Israel pulled back some troops in Gaza and because Iran failed to follow through on threats to respond to Israel’s attack on its consulate in Lebanon. Yet to say the market is on edge is an understatement as supply tightness is clear as we continue to see ongoing threats to supply. Move Israel in oil prices are seeking to regroup it’s the market waits to see if there are any other shoes to drop.
There is also a lot of speculation in the market that the Energy Information Administration has been overestimating US oil production by almost 1 million barrels per day. As we know the Energy Information Administration has consistently had to adjust their production estimates from their weekly reports and now it’s very clear to many in the industry that the numbers that they have been reporting fall short. HFI Research points out that the EIA admitted that they didn’t survey oil production but used a model to come up with their equation the model has had run of overestimating production.
This overestimating production means that the supply situation based on current demand is much tighter than we had originally thought. If you look at the demand numbers from last week in the United States, they say hit an incredibly high 21,292 million barrels a day. So if the pattern of overestimating production continues and underestimating demand we could be in a very interesting situation.
So with the reduction of geopolitical risk, we’re back to focus on supply and demand which still looks exceedingly tight this week we expect to see crude oil supplies fall by 3,000,000 barrels. We also expect to see the same in products with a 3 million barrel drop in both gasoline and distillates refinery run should see an uptick of 0.5.
B technical pullback is happening because crude is overbought and because of the reduction of geopolitical risk in this type of situation is going to be important to see whether or not the market consolidates where we see some further downside are expectation is that we will consolidate at some point because the supply versus demand situation is too tight to ignore and it’s too dangerous to allow prices to fall because we’re going to need to squeeze out as much production as we can to meet demand.
Based on what we’re seeing in industrial metals and gold the markets as expected to see some industrial demand big strength in both aluminum and copper is giving the market some support in this one of the reasons why oil isn’t falling out of bed despite being very overbought.
Javier Blass at Bloomberg pointed out that Vitol, the world’s largest independent oil trading company, has made more money in the last 3 years than during the past 30 years combined.
Gasoline prices are still above year-ago levels. AAA reports that The National Average was $3.598 slightly above yesterday and a year ago and about 5.7 cents a gallon a week ago.
You don’t have to go to Nova Scotia to see the total eclipse of the Sun but it might be a day that is not good for solar panels, sort of like when it hails or snows. The EIA reports that On April 8, 2024, a full solar eclipse will briefly but fully obscure sunlight to utility-scale solar generation facilities from Texas through Maine with a combined 6.5 gigawatts (GW) of capacity. In addition, the eclipse will partially block sunlight to facilities with a combined 84.8 GW of capacity in an even larger swath of the United States around peak solar generating time.
Solar-powered generators centered in the path of totality—where the moon will completely obscure the sun—will be affected the most because the moon will block all direct sunlight for more than four minutes. The partial eclipse could limit the sunlight in the path of totality for more than two hours. Areas around the path of totality will have varying levels of diminished solar generation during the eclipse. Because we know about the eclipse ahead of time, utilities have prepared and planned for the lost solar energy. Several grid authorities have released plans for how they plan to deal with the change in solar generation during the eclipse according to EIA. So, we have that going for us.
Natural gas rigs have fallen to the lowest level since January. Production of natural gas is starting to fall. Power burns for natural gas have been exceedingly high as low prices have encouraged demand we’re expecting to see an increase in supplies of about 15 BCF this week in the weekly report and it feels like the market is trying to put in the bottom. Still, the fundamentals in the glut is real so it’s probably best to be hedged with options.
Read Full Story »»»
DiscoverGold
Arabica Coffee ("The Good Stuff") jumps to 18-month highs
By: Barchart | April 5, 2024
• Arabica Coffee ("The Good Stuff") jumps to 18-month highs.

Read Full Story »»»
DiscoverGold
Natural Gas Price Forecast: Bullish Reversal on Rally Above Today’s High
By: Bruce Powers | April 5, 2024
• Natural gas sees further weakness before finding support at 1.755. An intraday bounce suggests potential for a completion to the current pullback, but further confirmation is needed.
Further weakness in natural gas leads to support at 1.755 and an intraday bounce. The decline earlier in Friday’s session completed a 61.8% Fibonacci retracement before buyers took control. Natural gas is on track to close in the green if the close is above the open, as it is at the time of this writing.
The prior pullback triggered a bullish reversal after two days and the same may happen in this current pullback. If today’s low continues to hold as support, it will mark a successful test of support at the purple 20-Day MA and is a sign of improving short-term strength.

Rally Above Today’s High Signals Further Upside
Heading into next week, a bullish signal will be generated on a rally above today’s high of 1.82. That should mark the completion of the current pullback and set the stage for moving higher. Nevertheless, a rally above yesterday’s high of 1.85 provides greater confidence that demand is improving as it would also mark an advance back above the 50-Day MA, now at 1.84.
That should prepare natural gas for a rally above the most recent swing high of 1.91. It will trigger a continuation of the advancing CD leg of a rising ABCD pattern with an initial target at 2.08. A daily close above the 50-Day line would provide a key signal confirming an improving uptrend as the natural gas has traded below the 50-Day line since mid-January.
Weekly Bullish Reversal Intact
A bullish reversal triggered this week on the weekly chart and the week will end with a higher weekly high and higher weekly low, a sign of a developing uptrend. Support on the weekly chart was seen this week at the 8-Week MA. It is a sign of improving strength in the weekly time frame. However, the week is on track to close relatively weak, in the lower half of the week’s range and below last week’s high of 1.83. What it tells us is that the longer-time frame pattern has become more bullish. And the larger time frames impact price behavior in the shorter time frames. A variety of possible upside targets are marked on the chart. The first is at the completion of the ABCD pattern.
Read Full Story »»»
DiscoverGold
The Corn & Ethanol Report. Economy-Markets & Positioning For Reality
By: Daniel Flynn | April 5, 2024
We kickoff the day with Unemployment, Non-Farm Payrolls, Average Hourly Earnings MoM & YoY, Fed Collins Speech, Participation Rate, Average Weekly Hours, Government Payrolls, Manufacturing Payrolls, Nonfarm Payrolls Private, and U-6 Employment Rate at 7:30 A.M., Fed Barkin Speech at 8:15 A.M, Fed Bowman Speech at 11:15 A.M., Baker Hughes Oil & Total Rig Count at 12:00 P.M., and Consumer Credit Change, Dairy Products, and Used Cars MoM & YoY at 2:00 P.M.
The volatile day in commodities markets yesterday as we started out sailing until gloom & doom overtook took over as a reminder of how bad of shape the economy is overall is very poor, and extremely bad news is ahead if the government doesn’t change it’s ways of spending money like a drunken sailor. No matter how you crunch the numbers the data we receive on a given report will only have negative revisions in the next report. The US trade deficit widened to $68.( billion in February, a $1.3 billion or 2% increase from January. It was also the widest trade gap in 10-months (Apr 2023). The trade deficit widened and exports rose 2.3%to a record high of $263 billion, led by civilian aircraft, crude oil, soybeans, and nonmonetary metals. However, imports increased 2.2% to $331.9 billion, the highest since October 2022. Imports were lifted by increases for cell phones and other household goods, pharmaceutical preparations, cars, parts, and other foods. The trade deficit with China narrowed to a 3-month low of $21.9 billion, while the deficit with Mexico widened to a record. Large $15.3 billion. The numbers are very disturbing.
South American weather watch has Brazilian rain expanding into the driest areas of Mato Grosso do Sul in a 6-10 day period, hints on monsoon exit beyond April 13th . Heavy showers will persist for another 10 days, with needed rainfall of 1-2” to reach into the driest areas of Center-West Brazil in the 6-10 day period. Soil moisture is the concern. Next week’s expansion of Brazil rain is welcomed, but ARC is noting the 11-15 day guidance features a rapid and significant retreat in Brazilian precipitation, with totals of 1+” isolated to far Northern Mato Grosso. Confirmation that monsoonal rains end in mid-April is most worrisome for southern safrinha corn belt-which experiences needed precipitation next week but need much more to maximize safrinha yield potential. Brazilian weather still needs watching as pollination spans from mid-April to early May. Record safrinha corn production a year ago was driven in part by soaking rain in the second half of April and regional showers in Mato Grosso into the first week of May.
The US forecast uncertain over Midwest rain the next 10 days while temps lean to warm/hot beyond the weekend. The EU & GFS models are at odds over the placement of rainfall in the E Midwest April 11-12.The GFS keeps meaningful rain confined to the Delta & East Coast. The EU also allows the Delta to get soaked but the projects rainfall of 1-3” in IL, IN, and OH. Fieldwork gets delayed into the E Midwest is correct, but concern today centers on net soil moisture loss across the Plains and flooding in South/Southeast. Both models agree on this. A lengthy period of dryness occurs west of the Miss River. There is no indication of meaningful rain across the Plains/W Midwest into April 20th . A much warmer temp profile develops on the weekend and continues throughout the 6-15 day period. Maximum highs in TX,OK,KS, and NE reach into the upper 70’s/low 80;s . Temps in the 60’s blanket the primary Corn Belt after April 8th . Regional plantings begins in the second half of April. As we look at the economy with the cost of groceries to feed your family skyrocketing in this horrendous economy we should be wary as wee add to the list of further costs and fear factor of beef, pork, poultry, eggs, and further animal slaughter do the Texas Panhandle fires and the bird-flu disease will only add to price headaches and possible food shortages. The CBOT futures are higher this morning, with the wheat markets globally pacing the advance. Strength in the EU & US market is due to the Russian government’s expanding control of the market there as well as the ongoing numerous weather issues. Traders will also be eyeing the Commitment of Traders data.
Read Full Story »»»
DiscoverGold
Called Out. The Energy Report
By: Phil Flynn | April 5, 2024
Crude oil prices tried to retreat but rebounded after Peter Doocy at Fox News called out the Biden administration for reversing its “unwavering support for Israel” and asking about reports of a possible warning to Israel of a planned Iranian attack on Israeli soil. This was in response to a statement by US Secretary of State Anthony Blinken that said that U.S. policy will change if Israel doesn’t change course and its war against Hamas. Mr. Doocy asked, “Did the CIA warn Israel or did President Biden warn Netanyahu today about an Iranian plan to attack inside Israel within 48 hours?” John Kirby: said “I’m not going to talk about intelligence matters, Peter. I think you can understand. Um, but, um, they didn’t talk.
Reports swirling about a possible attack by Iran on Israeli soil would be a definite escalation of the proxy war between Iran and Israel. That put the market in risk aversion mode causing stocks to sell off, oil to rally as people prepared for what could be a major price spike if this confrontation happens. The risk to oil flows, especially coming out of Iran, would be put at risk. Also reports that the UAE would announce a suspension of all diplomatic ties with Israel. It’s another blow to the Mideast peace process that showed so much hope under Donald Trump when they signed the Abraham Accords.
The US Congress is continuing to call out the International Energy Agency (IEA) and sent them another letter demanding more information as to why the IEA has abandoned its historical commitment to nonpartisan and objective analysis for climate policy advocacy. And while they were at it, they may want to call out our own Department of Energy for being blasted about the misleading way that they try to justify Biden’s electric car push when data is, at the very least, downright misleading, if not intentionally written in a way to hide the truth.
The Hill reports that Biden’s EPA can justify his new EV rules only by cooking the books. They write that, “Before federal regulations are implemented, they must be justified with an extensive analysis of costs and effects. The new Environmental Protection Agency rule forcing a massive shift toward electric vehicles is no exception. Weighing in at 1,181 pages, it is accompanied by an additional 884 pages of “regulatory impact analysis.” The EPA analysis justifying this rule is not unique in its length, but it is unique in its dishonesty. In a must read they wrote, “EPA claims that the rule will reduce total greenhouse gas emissions over 2027-2055 by 7.2 billion metric tons. But despite a long and disingenuous discussion of the purported adverse effects of greenhouse gas emissions, EPA admits that it “did not…specifically quantify changes in climate impacts resulting from this rule in terms of avoided temperature change or sea-level rise.” The reason for that failure is obvious: The answer would be embarrassing. If we apply EPA’s own climate model, with assumptions that exaggerate the climate effects of reductions in GHG emissions, the rule would reduce global temperatures in 2100 by 0.0068 degrees Celsius — an effect far too small to be detectable.
Yet somehow, the EPA claims that the rule will yield “climate benefits” of $1.6 trillion. How is that possible for a near-zero effect on temperatures? As with the entire Biden climate regulatory regime across all agencies, EPA multiplies asserted reductions in greenhouse gas emissions by the “social cost of carbon,” a fictitious number that supposedly measures damage caused by the emissions.
The Daily Caller reported that, “A government watchdog group has filed a complaint with the Biden administration over its use of a dataset frequently used to push its climate agenda. They wrote, “Protect the Public’s Trust (PPT) filed the complaint with the Commerce Department over the National Oceanic and Atmospheric Administration’s (NOAA) “Billions Project” dataset, which purports to keep track of natural [and climate] disasters that have caused at least $1 billion in damages going back to 1980. The billion-dollar disasters (BDD) data — cited frequently by the Biden administration to insinuate that climate change is intensifying and justify sweeping green policies — is based on opaque data derived from questionable accounting practices, PPT alleges in the complaint.
This is just some misinformation and geopolitical risk factors creating the potential for a major oil price spike that the Biden administration may be hard-pressed to stop. So far it looks like their plans are to try to cool prices or to try to look like they’re going to be tough on Russia, Venezuela and Iran while at the same time allowing those countries to export their oil or at the very least, their oil products.
The cancellation of the buyback for the Strategic Petroleum Reserve this week shows that the Biden administration must be very concerned about the global oil supply deficit. Supply deficit that was in part created by the government manipulating the market with releases from the strategic petroleum reserve before they were needed. Biden’s misuse of the strategic petroleum reserve angered OPEC and other oil producers and that is a reason that OPEC and Russia have continued to be very cohesive in reducing global oil output. By artificially lowering prices, it did not help with a demand response or a production response to the real market conditions. And while the Biden administration may have benefited from the short-term price drop, it’s becoming more apparent with the looming global supply deficit that the misinformation provided by the reporting agencies and the SPR left the market short of supply.
Javia Blass says that all this turmoil will lead the Biden administration into a predictable pattern of damage control. First, they stopped further purchases for the SPR, then they announced there would be no reimposition of Venezuelan oil sanctions. Blass expects what will follow is to put pressure on OPEC to raise production. When that fails and it most likely will, they will start putting pressure on U.S. oil companies again probably calling them price gougers or war profiteers.” Lastly, they’ll go back to the bullpen and start releasing oil from the SPR even though it’s been depleted to the lowest level in over 40 years. Now there are also reports that the Biden administration is talking about lifting its terror designation on the rebels if they just promise to stop attacking ships in the Red Sea. I am assuming that the Biden administration is saying please on that one.
Russia is also talking about limiting gasoline exports. This could be in response to the attacks on the refineries by Ukrainian drones. Russian refineries will not be back to full operation until June according to Russia and it’s possible that the attacks on Russian refineries have not stopped.
In other words, it seems like the oil markets are getting shot out of their complacency. The reason why I continued to keep a bullish outlook, even when the prices looked over bought, was because I could see that beneath all the noise and the rhetoric, the supply versus demand fundamentals were much tighter than the market was giving it credit for. The reason why we suggested to keep hedged was exactly the situation that has been developing over the past few months. Despite all the doom and gloom about the economy and the potential for peak oil demand, we could see pretty clearly based on global daily demand versus daily global production as well as global inventories, that supplies are tighter than they’ve ever been or at least in a generation. And while the market seems to think this happened overnight, it’s been a long time since it’s been developing. The sad part about this is that a lot of this could have been avoided.
Natural gas got a bearish report. But the market is holding on to hopes of more production cuts. Working gas in storage was 2,259 Bcf as of Friday, March 29, 2024, according to EIA estimates. This represents a net decrease of 37 Bcf from the previous week. Stocks were 422 Bcf higher than last year at this time and 633 Bcf above the five-year average of 1,626 Bcf. At 2,259 Bcf, total working gas is above the five-year historical range.
Read Full Story »»»
DiscoverGold
Coffee is absolutely exploding higher (daily chart):
https://finviz.com/futures_charts.ashx?t=KC&p=d
Natural Gas Pulls Back After Failed Breakout Attempt
By: Bruce Powers | April 4, 2024
• Natural gas retreats, testing key support near 8-Day MA at 1.77, following bearish candlestick pattern.
Following Wednesday’s bearish shooting star candlestick pattern, natural gas pulls back to test support around the 8-Day MA (1.77). It has fallen back below the long-term downtrend line and continues to trade near the lows of the day, at the time of this writing. The current low for the day is 1.77. If the retracement continues next watch for possible support around the 20-Day MA, currently at 1.74. This is just the first day of a pullback, so another one or two days of weakness would not be surprising.
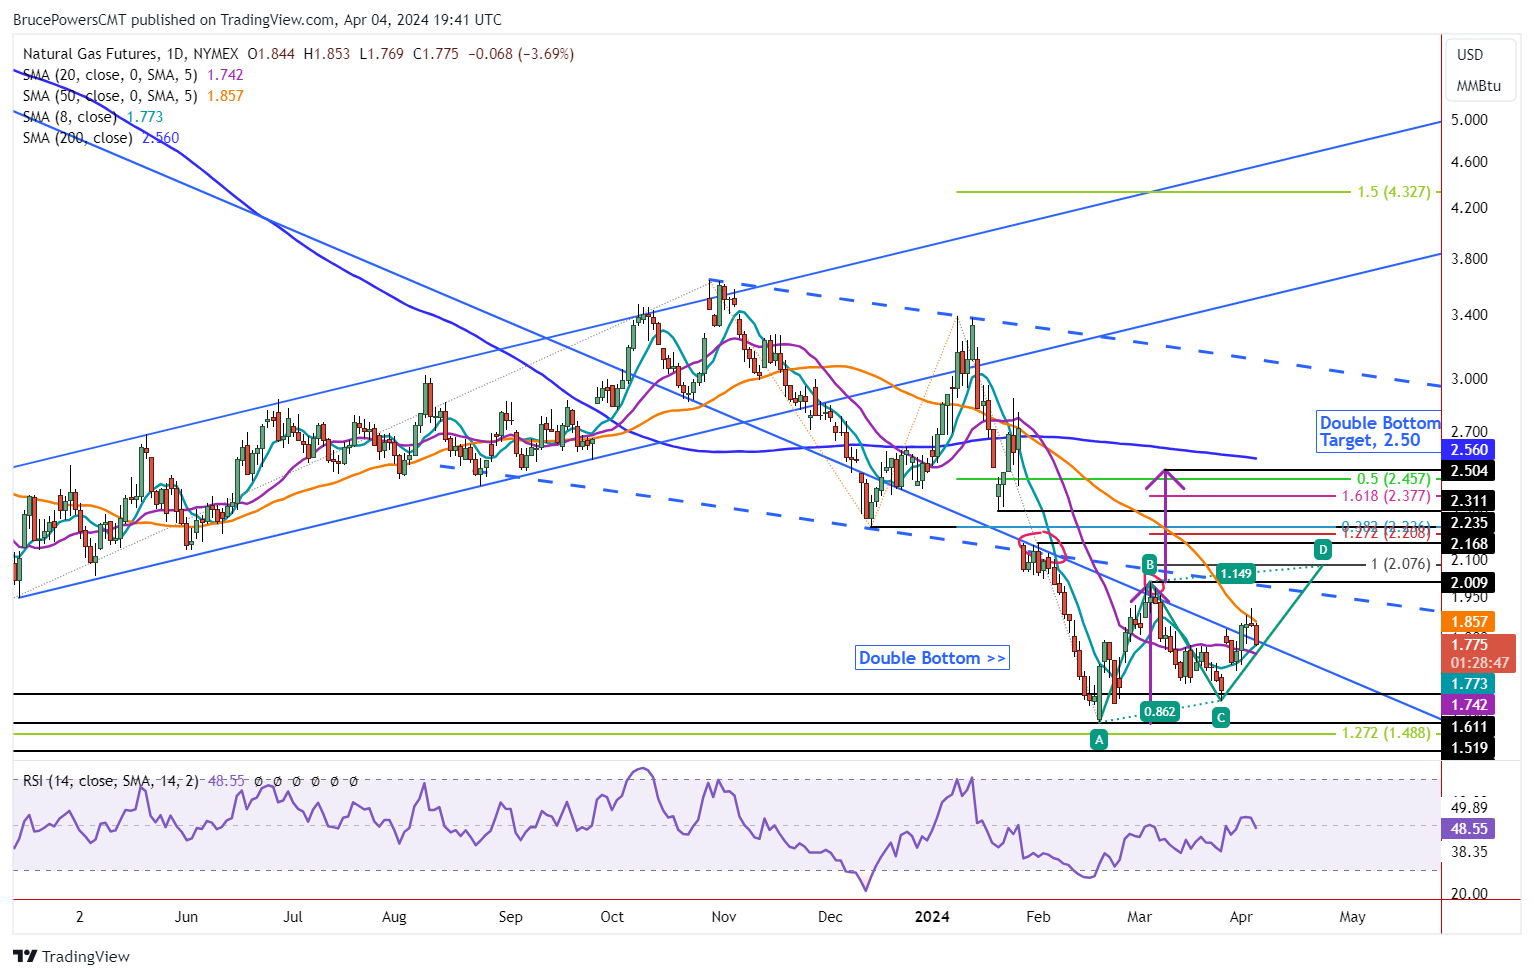
Failed Breakout Above 50-Day Moving Average
Natural gas turned lower yesterday following a failed attempt to break out above the 50-Day MA. That was the first time it was approached since late last year. It is not unusual for price to be rejected the first time a common moving average is approached after being away from it for a while. Currently, it is at 1.86 and was tested as resistance earlier in today’s session and rejected to the downside.

Weekly Chart Shows Demand Increasing
When looking at the 8-Week MA on the weekly chart the situation with natural gas gains some clarity. Notice that this week’s low successfully tested support at the 8-Week line with a low of 1.71. Last week, the 1.75 closing price was above the 8-Week MA for the first time since the week of January 22. This shows momentum beginning to switch from bearish to bullish as a potential bottom further develops. There is only one more day to the week with the current weekly pattern reflecting some uncertainty about a bottom.
Weekly Bullish Reversal Triggered
Nonetheless, this week’s advance triggered a bullish reversal on the weekly chart. A close this week above last week’s high of 1.83 would be a stronger close than one below that price level. Currently, natural gas is trading below it. The weekly chart also shows a higher weekly low and higher high, to go along with the recent higher swing low. Each is a bullish sign.
So far upward momentum has been muted, but that can change quickly once the 50-Day MA is exceeded for a second time. A double bottom pattern remains a possibility, while the first higher target is at 2.08, which completes a rising ABCD pattern.
Read Full Story »»»
DiscoverGold
Quietly, gold, silver, copper, oil, gasoline & coffee are on a rampage.
Index Funds & Economy. The Corn & Ethanol Report
By: Daniel Flynn | April 2, 2024
We kickoff the day with Redbook YoY at 7:55 A.M., Jolt’s Job Openings, Factory Orders MoM, Factory Orders ex Transportation, and Jolt’s Job Quits at 9:00 A.M., Fed Bowman Speech at 9:10 A.M., 42-Day Bill Auction at 10:30 A.M., Fed Williams Speech at 11:00 A.M., Fed Mester Speech at 11:05 A.M., Fed Daly Speech at 12:30 P.M., API Energy Stocks at 3:30 P.M., LMI Logistics Managers Index and Total Vehicle sales.
The Institute for Supply Management monthly Manufacturing Manager’s Index rose to an 18-month high of 50.3 in March. This was up from 47.8 in February and above the average trade estimate of 48.4. The index was up 5% from February, marking the strongest monthly increase since October 2020, and it was up 8% from a year ago marking the strongest year-over-year increase since August 2021. Businesses reported upticks in new orders, reflecting improving demand while also reporting that backlog’s had declined. However, employment numbers also remained in retreat while prices continued to move higher due to rising raw material prices.
The South American latest weather pattern update has El Nino reaching its zenith and is quickly collapsing in the equatorial Pacific. The encircled areas reflect where cooling is occurring with the current demise of the 2023/24 El Nino most like that of 1982/83 The analog and models forecasts that La Nina be in place by August and impact global weather patterns in the last quarter of 2024. All of the models forecast strengthening La Nina into 2025. The most adverse crop impact will again centered on Argentina. The impact on Central US weather this summer will be closely followed, but it’s the speed that La Nina develops and whether a Trough of Low Pressure holds across the Gulf of Alaska which would send the jet stream into the Western US with a high pressure Ridge forming across the South Central US this summer, but the location of most extreme heat has yet to be determined. Spring rainfall totals and soil moisture will determine the Ridges position.
Now that the quarterly stocks and Prospective Plantings behind us the CBOT markets came in mixed and some traders are stunned as we have not formed a low and waiting for a follow through rally. Traders will be watching weather and the Commitment of Traders more closely. Record gold prices and rising energy prices energy values could be the pressure that is starting to underpin the grain complex. WTI crude traded above $85 a barrel for the first time since October on rising Mideast tensions and strong world demand. Nearby crude prices are trading at strong premiums to back months, a sign of stout nearby refinery demand. A further rise in WTI would break another downtrend line that extends back to the 2022 high. Investment flows into the energy and metals markets is based on strengthening world economic outlook.
Monday’s CBOT open interest expanded with soybean oil up 8,507 contracts, soybean meal up 4,378 contracts, and soybeans up 3,511 contracts. Wheat open interest gained 6,761 contracts while corn was down 2,391 contracts. It appears managed money is putting a larger net short positions in soybeans, wheat and soybean meal. The CFTC data shows that index funds are returning to raw material markets as world interest rates decline.
Read Full Story »»»
DiscoverGold
Grains Report: Wheat, Rice, Corn and Oats, Soybeans, Canola and Palm Oil
By: Jack Scoville | April 2, 2024
• WHEAT
General Comments: Wheat was lower yesterday in anticipation of much improved crop condition ratings in the USDA reports that were released yesterday afternoon. There was also news that some shipments of Wheat sold by RiF were released by the Russian government. The USDA reports released Friday were considered friendly for Wheat prices, but futures closed mostly lower anyway and were led lower by Minneapolis. USDA said that All Wheat plantings would be about 47.5 million acres, with the big reductions seen in Winter Wheat. In contrast, Spring Wheat plantings were above the trade guesses at 11.335 million acres. Inventories were just above the average trade guess and 1.083 billion bushels. The problems with Russian Wheat exporter RiF continue. The dispute has held up shipments of at least 400,000 tons of grain so far although a few shipments were released by the government over the weekend. The reports indicate that the government is seeking more control of the exports and has made life very difficult for the private exporters in an effort to extract more sales and powers to the government. Russia is the world’s largest exporter and sets the world price and prices remain low. Big world supplies and low world prices are still around. Export sales remain weak on competition from Rusia, Ukraine, and the EU as those countries look to export a lot of Wheat in the coming period. Black Sea offers are still plentiful.
Overnight News: The southern Great Plains should get Scattered showers. Temperatures should be below normal. Northern areas should see scattered showers. Temperatures will average below normal. The Canadian Prairies should see scattered showers. Temperatures should average below normal.
Chart Analysis: Trends in Chicago are mixed. Support is at 539, 537, and 527 May, with resistance at 568, 572, and 580 May. Trends in Kansas City are mixed. Support is at 572, 567, and 564 May, with resistance at 594, 602, and 605 May. Trends in Minneapolis are mixed to down with objectives of 620 and 597 May. Support is at 629, 622, and 616 May, and resistance is at 647, 660, and 669 May.
• RICE
General Comments: Rice closed lower again yesterday and at new lows for the move. Trends are down in this market. Good demand for exports continues. The overseas markets feature less production in Brazil and India, and it appears that the lack of offer from these markets is supporting increased demand for US Rice and prices here in the US. It turned wetter and colder in the US last week and fieldwork will be much reduced.
Overnight News:
Chart Analysis: Trends are down with no objectives. Support is at 1624, 1612, and 1600 May and resistance is at 1678, 1744, and 1751 May.
• CORN AND OATS
General Comments: Corn and Oats closed lower yesterday. USDA issued its first crop progress report for Corn yesterday. The USDA reports released on Friday showed inventories and planting ideas below trade expectations. USDA said that plantings should be just 90 million acres and that inventories are estimated at 8.347 billion bushels. The plantings intentions report was especially bullish for Corn prices. Demand for Corn has been strong at lower prices. Big supplies and reports of limited demand are still around, but futures have been very oversold. Futures are much lower than just a few months ago and a short covering rally is increasingly expected and might start next week. Funds remain very large shorts in the market. Basis levels have firmed a little bit in the US as processors look for supplies amid tight farmer holding patterns. The weather forecasts for Argentina are improving with drier weather expected this week after some big rains last week. More rain is forecast for central and northern Brazil, but dry weather is forecast for southern Brazil The planting progress reports to date indicate rapid progress and reports from Brazil indicate that the Winter crop has been mostly planted now.
Overnight News:
Chart Analysis: Trends in Corn are mixed. Support is at 432, 426, and 422 May, and resistance is at 448, 459, and 463 May. Trends in Oats are mixed. Support is at 353, 349, and 344 May, and resistance is at 362, 369, and 374 May.
• SOYBEANS
General Comments: Soybeans and Soybean Meal closed lower yesterday in reaction to the USDA reports that showed slightly higher quarterly stocks and planting intentions when compared to expectations and on ideas of increased farm selling. USDA said that the stocks were 1.845 billion bushels and that farmers would plant 86.5 million acres of Soybeans. Brazil producers had been taking advantage on higher futures in the US and higher basis levels in Brazil, but the basis has fallen sharply in Brazil this week and sales have been less. Reports of great export demand in Brazil provide some support. Reports indicate that China has been a very active buyer of Brazil Soybeans this season. Ideas that South American production is taking demand from the US have pressured futures lower. Funds remain large shorts in the market. Basis levels in the US are reported to be firming as processors look for supplies and farmers remain tight holders.
Overnight News:
Chart Analysis: Trends in Soybeans are mixed. Support is at 1181, 1175, and 1165 May, and resistance is at 1217, 1227, and 1233 May. Trends in Soybean Meal are mixed. Support is at 326.00, 320.00, and 317.00 May, and resistance is at 340.00, 348.00, and 352.00 May. Trends in Soybean Oil are mixed. Support is at 4820, 4730, and 4690 May, with resistance at 4910, 4980, and 5000 May.
• CANOLA AND PALM OIL
General Comments: Palm Oil was lower last week on ideas of increasing world supplies of vegetable oils. Prices moved higher today on strong export data for the month from private sources. The export pace is expected to continue to really improve but this is part of the price already. The Southern Peninsula Palm Oil Millers Association expects Malaysia’s palm oil production for March 1-20 to have risen 22%. Domestic biofuels demand is likely to improve. Ideas of weaker production ideas against good demand still support the market overall. The fundamentals of average demand against a weaker supply outlook are still around to keep prices supported. Trends are turning down on the daily charts. Canola was higher yesterday. There were reports of big rains in Argentina, but forecasts for drier conditions now and improving weather in Brazil. Current forecasts call for generally improved growing conditions in Brazil this week.
Overnight News:
Chart Analysis: Trends in Canola are mixed to down with objectives of 617.00 and 596.00 May. Support is at 616.00, 610.00, and 602.00 May, with resistance at 652.00, 657.00, and 660.00 May. Trends in Palm Oil are mixed to down with objectives of 4070 and 3920 June. Support is at 4200, 4130, and 40\50 May, with resistance at 4280, 4310, and 4330 May.
Midwest Weather Forecast Showers and storms. Temperatures should average below normal.
Read Full Story »»»
DiscoverGold
Softs Report: Cotton, OJ, Coffee, Sugar, Cocoa
By: Jack Scoville | April 2, 2024
• COTTON
General Comments: Cotton was higher yesterday, but trends are still trying to turn down on concerns about the planting intentions report released Friday morning and despite improving ideas of demand potential from China. USDA said that 10.7 million acres might get planted this year, from 10.2 million last year. It is too early to plant in Texas but the heat and dry weather raises concerns about production potential later in the growing season and blackened soils might not permit much planting, anyway. The demand news has been solid but reduced from previous levels in this market for the last several weeks. The US economic data has been positive, but the Chinese economic data has not been real positive and demand concerns are still around. However, Chinese consumer demand has held together well, leading some to think that demand for Cotton in world markets will increase over time.
Overnight News: The Delta will get showers and rains and near normal temperatures. The Southeast will see showers and near normal temperatures. Texas will have mostly dry conditions and near to below normal temperatures. The USDA average price is now 85.86 ct/lb.
Chart Trends: Trends in Cotton are mixed. Support is at 90.50, 88.10, and 86.20 May, with resistance of 94.30, 96.20 and 97.70 May.
This Week Last Qeek Last Year Average
Cotton Planted 3 3 4
• FCOJ
General Comments: FCOJ closed sharply higher to limit up yesterday but remains in a trading range. Reports of tight supplies are around. Florida said that Oranges production will be low, but above a year ago. Futures still appear to have topped out even with no real downtrend showing yet, so a range trade has been seen. Prices had been moving lower on the increased production potential for Florida and the US and in Brazil but is now holding as current supplies remain very tight amid only incremental relief for supplies is forecast for the coming new crop season. There are no weather concerns to speak of for Florida or for Brazil right now. The weather has improved in Brazil with some moderation in temperatures and increased rainfall amid reports of short supplies in Florida and Brazil are around but will start to disappear as the weather improves and the new crop gets harvested.
Overnight News: Florida should get scattered showers or dry conditions. Temperatures will average near normal. Brazil should get scattered showers and above normal temperatures.
Chart Trends: Trends in FCOJ are mixed. Support is at 358.00, 347.00, and 353.00 May, with resistance at 378.00, 389.00, and 391.00 May.
• COFFEE
General Comments: New York closed higher yesterday with London closed. New York shows no direction right now in prices on the daily charts. The lack of Robusta Coffee in the market continues to support futures. Robusta offers from Vietnam remain difficult to find and the lack of offer of Robusta is a bullish force behind the London market action. Vietnamese producers are reported to have about a quarter of the crop left to sell or less and reports indicate that Brazil producers are reluctant sellers for now after selling a lot earlier in the year. The next Robusta harvest in Brazil will start next month. Brazil weather continues to improve for Coffee production and conditions are called good.
Overnight News: The ICO daily average price is now 191.28 ct/lb. Brazil will get mostly scattered showers with near normal temperatures. Central America will get mostly dry conditions. Vietnam will see scattered showers
Chart Trends: Trends in New York are mixed to up with objectives of 193.00 and 201.00 May. Support is at 188.00, 186.00, and 183.00 May, and resistance is at 194.00, 196.00 and 199.00 May. Trends in London are up with no objectives. Support is at 3460, 3420, and 3360 May, with resistance at 3600, 3630, and 3660 May.
• SUGAR
General Comments: New York and London closed higher yesterday, and London was closed for the holiday. Ideas of stronger demand have surfaced, and producers do not appear to be selling much. Indian production estimates are creeping higher but are still reduced from recent years. There are worries about the Thai and Indian production. Offers from Brazil are still active but other origins. are still not offering in large amounts except for Ukraine. Ukraine offers have suffered lately with the war. Demand reports from Europe have been strong.
Overnight News: Brazil will get rains in the south and scattered showers in the north. Temperatures should average above normal. India will get mostly dry conditions and below normal temperatures.
Chart Trends: Trends in New York are up with objectives of 2360, 2390, and 2400 May. Support is at 2210, 2170, and 2110 May and resistance is at 2290, 2320, and 2360 May. Trends in London are mixed to up with objectives of 676.00 and 698.00 May. Support is at 634.00, 629.00, and 619.00 May, with resistance at 667.00, 670.00, and 680.00 May.
• COCOA
General Comments: New York was sharply higher yesterday with London closed for a holiday. Production concerns in West Africa as well as demand from nontraditional sources along with traditional buyers keep supporting futures. Production in West Africa could be reduced this year due to the extreme weather which included Harmattan conditions. The availability of Cocoa from West Africa remains very restricted and projections for another production deficit against demand for the coming year are increasing. Ideas of tight supplies remain based on more reports of reduced arrivals in Ivory Coast and Ghana continue. Demand continues to be strong, especially from nontraditional buyers of Cocoa.
Overnight News: Isolated showers are forecast for West Africa. Temperatures will be near normal. Malaysia and Indonesia should see scattered showers. Temperatures should average near normal. Brazil will get isolated showers and above normal temperatures.
Chart Trends: Trends in New York are mixed to up with no objectives. Support is at 9630, 9000, and 8410 May, with resistance at 10320, 10440, and 10560 May. Trends in London are up with no objectives. Support is at 7860, 7500, and 6960 May, with resistance at 8660, 8720, and 8840 May.
Read Full Story »»»
DiscoverGold
Oil At $85.00. The Energy Report
By: Phil Flynn | April 2, 2024
Oil is surging to another yearly high as demand expectations rise, supply falls, geopolitical risks rise and OPEC March Oil output falls by 50,000 bpd from February to 26.42 million bpd according to the latest survey. Export cuts by Mexico to the tune of 600,000 barrels a day come on a day when manufacturing data and prices paid data in the US came in much stronger than expected. Then heightened geopolitical risks rose higher after a missile attack hit an Iranian diplomatic building in Damascus that killed a senior Iranian general. Iran said it was an Israeli attack that would demand an Iranian response. Iran is blaming Israel and the United States.
Iran’s Ali Khamenei is vowing to punish Israel after the deadly attacks while Iran reportedly is in backdoor conversations with the United States to try to ease tensions that could boil over into a confrontation that both Iran and the United States are trying to avoid. Iranian state media said the attack on Monday killed a senior leader in the elite Quds Force of Iran’s Islamic Revolutionary Guard Corps, which oversees Tehran’s network of militia allies throughout the region. The commander, Gen. Mohammad Reza Zahedi, managed Iranian paramilitary operations in Syria and Lebanon, according to Iranian state media and U.S. officials.
This came after a report that the Chinese manufacturing sector expanded stronger than anticipated. We also got a report from the ISM manufacturing here in the United States that showed that the US manufacturing sector is rebounding.
Bloomberg News reported that US factory activity unexpectedly expanded in March for the first time since September 2022 on a sharp rebound in production and stronger demand, while input costs climbed. The Institute for Supply Management’s manufacturing gauge rose 2.5 points to 50.3 last month, according to data released Monday. While barely above the level of 50 that separates expansion and contraction, it halted 16 straight months of shrinking activity. That report added to demand expectations for oil and products. And with the global well supply deficit already developing, the increased risk to supplies will keep the market on edge. Oil products like gasoline and diesel are starting to bounce back after being skeptical about the move but the inventories for products around the globe are below average and that should keep the market well supported on breaks. Bloomberg reported, “Mexico’s Pemex will ship less oil in a push to feed domestic refineries reducing Mexico’s exports by about 600,000 barrels a day of Maya crude oil.
There are more questions as to whether the US oil and gas industry can continue to overcome the hostile regulatory environment of the Biden administration. The American Petroleum Institute (API) is warning that the US will lose its energy advantage as the Biden administration continues to push short-sighted regulations on electric vehicles and new methane taxes that will severely curtail US oil and gas production and give our advisories a huge economic and military advantage.
In a release, the API and the Energy Workforce & Technology Council joined with 18 other associations representing all segments of the U.S. oil and gas industry operating across the country in calling on the U.S. Environmental Protection Agency (EPA) to revise its “misguided” methane fee on American energy. In comments submitted to the agency on the “waste emissions charge” proposed rulemaking, the associations argued that EPA’s proposed rule creates an incoherent regulatory regime, fails to meet the statutory requirements outlined by the Inflation Reduction Act, and disincentivizes emissions reduction efforts by the industry. “This tax on American energy is a serious misstep that could jeopardize our nation’s energy advantage and weaken our energy security,” said API Senior Vice President of Policy, Economics and Regulatory Affairs Dustin Meyer. “U.S. oil and natural gas is innovating throughout its operations to reduce methane emissions while meeting growing energy demand. Yet, this proposal creates an incoherent, confusing regulatory regime that will only stifle technology advancements and hamper energy development. With partners across the industry, we will consider all options to ensure a smart regulatory framework for continued American energy development.”
One way to reduce greenhouse gas emissions of course is going nuclear just don’t tell Jane Fonda. But the reality is that nuclear may play an even bigger part in the world’s quest to reduce greenhouse gas emissions than many may have imagined. Bloomberg News is reporting that, “US oil companies including Diamondback Energy are considering small nuclear reactors to power drilling operations in Texas’s Permian Basin. And for all those young people that are worried about climate change, wait till we tell them that we’re going to be using small nuclear reactors to power oil drilling. I don’t think they’ll ever leave their safe spaces again.
Natural gas seems to have everything against it but the charts look like they’re trying to turn positive. There is a strong seasonal tendency for the September natural gas to rally over the next month but it’s still facing some incredible hurdles when it comes to the supply side and the lack of winter. This late blast of winter is too little too late to have a meaningful impact but what could have an impact is continued production cuts at some point this comes as the Energy Information Administration touts the fact that the US is the biggest LNG exporter in the world which is a great thing if you want to replace coal around the world.
Read Full Story »»»
DiscoverGold
Commodities Daily Market Movers (% Price Change)
By: Marty Armstrong | April 2, 2024
• Top Movers
NY Natural Gas Futures 4.2 %
Tokyo Palladium Futures 3.96 %
Cocoa (NYCSCE) Futures 3.62 %
Orange Juice (NYCE) Futures 2.75 %
Cotton 2.27 %
• Bottom Movers
Live Cattle Futures (CME) 2.74 %
Platinum / Gold Ratio 2.44 %
Feeder Cattle (CME) Futures 2.42 %
NY Palladium Futures 1.71 %
Corn (CBOT) Futures 1.49 %
*Close from the last completed Daily
DiscoverGold
Natural Gas Bullish Weekly Reversal Points to Higher Prices
By: Bruce Powers | April 1, 2024
• Bullish momentum in natural gas confirmed, with potential for breakout to higher prices as technicals show signs of strength.
Natural gas triggered a bullish reversal on Monday in both the daily and weekly time frames, as it advanced above Friday’s high and then exceeded last week’s high of 1.83. It continues to trade near the highs of the day at the time of this writing and is well positioned to close strong, in the upper quarter of the day’s range. In addition, natural gas has a chance to end Monday’s session above last week’s high, which would further confirm strength. It is on track to close above both the 20-Day MA (purple) and long-term downtrend line. Each metric shows improving strength in demand. Natural gas has not been able to close above the downtrend line since January 26.

Second Bottom is Set for Potential Double Bottom
Today’s advance confirms the completion of a minor pullback and further confirms the higher swing low bottom from four days ago at 1.59 (C). A higher swing low is a sign of strength and is bullish. It begins the second leg up of a rising ABCD pattern. The initial target from the pattern completes where there is symmetry between the two swings, at 2.01. The secondary target, where the CD leg of the advance is extended by 127.2% of the AB leg, is at 2.21.
Eyeing Recapture of Downtrend Line
Once a daily close occurs above last week’s high, and above the downtrend line, the chance for a continuation higher improves. The next key encounter will be with the 50-Day MA (orange) at 1.90, as it represents dynamic resistance for the recent part of the downtrend. Natural gas has been trading below it since January 18. A daily close above the 50-Day line will show further signs of strengthening and again improves the possibility of the developing uptrend continuing to higher prices.
Higher Swing Low is Sign of Demand Improvement
The completion of the higher swing low at point (C) increases the chance for an eventual breakout of a double bottom pattern as the setup exists. However, as with all patterns, they need a trigger to confirm a breakout. That will happen on the double bottom pattern on a rise above the most recent swing high at 2.01. Subsequently, a daily close above that high will confirm the double bottom. It will also put natural gas in a position of having a higher swing high to follow the recent higher swing low.
Read Full Story »»»
DiscoverGold
No Fooling. The Energy Report
By: Phil Flynn | April 1, 2024
Oil and commodities are on fire with gold hitting a new all-time high and copper soaring after China’s manufacturing data hit a six-month high. China’s purchasing managers index rose to 50.8 from 49.1 in February beating expectations and Fed Chair Jerome Powell said that the February personal-consumption expenditures data was “pretty much in line with expectations,” and that he didn’t see elevated inflation risks. Oil trade should stay solid as Russia plans to cut its diesel exports by sea in April to a five-month low in the daily flows of exports from Russian ports are down 21%. Bloomberg is showing the impact of the diesel flows as Ukrainian drones hit Russian refineries. Russia has responded by attacking Ukraine’s energy infrastructure as well and we saw reports of power outages in Odessa and Kharkiv over the weekend. That, along with expectations that OPEC and Russia will follow through with their production cuts, is adding to the likelihood of an oil supply deficit as we head into the summer driving season.
Yet despite the turmoil around the globe, it seems that the Biden Administration wants to give China another big win at the expense of the US taxpayer as it drives deep into its fool-hardy obsession with electric vehicles. No fooling. China is getting a big boost of economic stimulus in part courtesy of the Biden administration as it believes they try to force electric cars down the throats of US businesses that don’t want them with no discernible help to the environment or have any impact on climate change. No fooling.
Yes, we are seeing oil prices start firm and a new record high in gold and a surge in copper prices as Chinese manufacturing hits a six-month high. So, it is head scratching time to see the Biden administration foolishly double down and its foolhardy attempt to try to electrify automobiles and the US truck fleet. A task that doesn’t make sense from a scientific standpoint but if you believe some of the economic pain it will cause and the advantage it gives to China, somehow atones for what they see as environmental injustices.
The Hill writes that, “An estimated 72 million Americans, often people of color or people with lower incomes, live near freight truck routes,” EPA Administrator Michael Regan said. “These communities are disproportionately exposed to the pollution from heavy-duty vehicles, resulting in higher rates of respiratory and cardiovascular illnesses and even premature death,” he added. “Reducing emissions from our heavy-duty vehicles means cleaner air and less pollution.” The Biden administration is fooled into believing that they are saving the planet but foolishly what they are doing is costing the US jobs and adding to inflation.
For the sake of optics, they foolishly enrich China which will benefit from this foolish policy while it may add to carbon emissions. While the EPA tries to tell us that this plan will “avoid” one billion metric tons in CO2 emissions from 2027 through 2055.
The Wall Street Journal points out that emissions from China and India rose last year alone. The Wall Street Journal points out that the, “EPA says its big-rig quotas are feasible because the Inflation Reduction Act and 2021 infrastructure law include hundreds of billions of dollars in subsidies for EVs. This includes a 30% tax credit for charging stations, a $40,000 tax credit for commercial EVs, and a tax credit for battery manufacturing that can offset more than a third of the cost. IRA tax credits for electric trucks aren’t conditioned on the source of battery material, so expect most to come from China. China’s BYD was California’s top-selling electric truck maker in 2022. Biden officials say Chinese green-technology manufacturers are flooding the U.S. market, but their mandates and subsidies are the reason.” They foolishly don’t even consider the real cost and it’s the real impact on inflation. They are foolish enough to believe that somehow, it’s OK to destroy the middle class by increasing their costs in the name of what they call environmental justice, which is kind of like a religion, to them I guess. Of course, these are the same people who foolishly believe that calling Easter, the most holy day in the Christian calendar, Transgender Day of Visibility would not be deeply offensive to Christians all over the world. This administration seems to offend anybody who gets in the way of their agenda and gets offended by the truth.
The Biden administration had harsh words for the US oil and gas industry as well as mom-and-pop gas station owners whom they accused of being price gougers and war profiteers. This is an administration that then turned a blind eye to Iranian oil sanctions and allowed Iran to make billions of dollars while they spread their errors throughout the world by supporting terror groups like Hamas, Hezbollah and the Houthi rebels. The Biden administration also is now not going to enforce sanctions on Venezuela mainly because they’re concerned about rising gasoline prices and imperiling Biden’s reelection chances.
We saw an uptick in gasoline demand as spring break and Easter travel gave us a bounce. AAA says that, “Gas prices are at 3.536 a gallon slightly more than yesterday and more than a week ago an about 14 cents a gallon more than a week ago. Prices are in overbought territory but we don’t see a big correction coming anytime soon. More than likely there will be a little bit of consolidation as we start to move higher. Inventory this week is expected to be relatively flat but we could see a drop in products like gasoline and diesel. OPEC and Russia are showing unity.
Natural gas prices continue to struggle even as Chesapeake Energy plans to put 80 new natural gas wells into suspended animation by the end of this year other firms like QG are shutting in wells we’ll see if it gives the market a bit of support.
Read Full Story »»»
DiscoverGold
Coffee Hits All-Time High
By: Barchart | March 28, 2024
• Robusta Coffee just hit an all-time high! First, they take OJ from us, then chocolate, and now coffee. This is too much, folks.

Read Full Story »»»
DiscoverGold
Natural Gas Eyes Bullish Reversal from Retracement Low
By: Bruce Powers | March 28, 2024
• Natural gas bounced from 1.69 low, eyes bullish reversal above 1.76 with potential to eventually breakout of double bottom pattern.
Natural gas falls to a new retracement low of 1.69 before finding support and bouncing intraday. It is possible that today completes a two-day retracement as a 61.8% Fibonacci level was just below today’s low at 1.68. Today’s high of 1.76 found resistance at the 20-Day MA (purple). Today’s candle sets up for a bullish reversal signal on a decisive rally above today’s high. Natural gas would then be heading for the recent swing high of 1.83 with the potential to breakout above that price level.

Rally Above 1.83 Confirms Strength
A rally above 1.83 would trigger a continuation of the rally begun from the recent swing low at 1.59 (C). That low is a second bottom that sets up a potential double bottom bullish reversal pattern. It triggers on a move above the March 5 swing high at 2.01. Until then it is a potential double bottom. The target derived from the pattern is approximately 2.50. If reached, it would put natural gas a little below the 200-Day MA, currently at 2.57.
Eyes Breakout Above Long-term Downtrend Line
If natural gas can close above the 1.83 swing high it will have broken back above the long-term downtrend line, which has represented dynamic resistance since the end of January. That would provide a clear sign that the price of natural gas is continuing to strengthen and that the current rally has the potential to reach higher targets. Subsequently, we will need to see further confirmation of strength to indicate that it can keep rising. The 50-Day MA is a target and it currently sits at 1.91. A daily close above it will indicate improving demand and improve that chance that natural gas keeps rising.
Rise Above 2.01 Needed for Sustainable Signs of Strength
Resistance was seen on the last advance at 2.01 (B). That is right around previous support seen at the prior trend lows in 2023. A daily close above that level would provide a sign that demand is continuing to strengthen on the way up. It triggers a breakout of the double bottom and confirms a continuation of the counter-trend rally. The next higher target would then be the February 1 swing high of 2.17.
Read Full Story »»»
DiscoverGold
The Corn & Ethanol Report
By: Daniel Flynn | March 28, 2024
We kickoff the day with Export Sales, GDP Growth Rate QoQ Final (Q4’23), Corporate Profits QoQ, GDP Price Index QoQ Final, Initial Jobless Claims, Continuing Jobless Claims, Core PCE Prices QoQ Final, GDP Sales QoQ Final, Jobless Claims 4-Week Average, PCE Prices QoQ Final, and Real Consumer Spending QoQ Final at 7:30 A.M., Chicago PMI at 8:45 A.M., Michigan Consumer Sentiment Final, Pending Home Sales MoM & YoY, Michigan 5-Year Inflation Expectations Final, Michigan Consumer Expectations Final, Michigan Current Conditions Final, and Michigan Inflation Expectations Final at 9:00 A.M., EIA Natural Gas Storage at 9:30 A.M., Kansas Fed Composite Index and Kansas Fed Manufacturing Index at 10:00 A.M., 4-Week & 8-Week Bill Auction at 10:30 A.M., Prospective Plantings, Quarterly Grain Stocks, 15-Year & 30-Year Mortgage rate at 11:00 A.M., Baker Hughes Oil & Total Rig Count at 12:00 P.M., and Hogs & Pigs at 2:00 P.M.
As we digest all the quarterly reports, and added reports we the long weekend in observance of Good Friday & Easter. We are here at the awaited Quarterly Grain Stocks and Prospective Plantings will finalize farmers early intentions with incoming revenue the most highest priority in these markets. New activity with funds leading to further speculation that the new index fund money is not just being bottom feeders but is shorting or adding to shorts in this heavy volatile bear stand. Bullish fundamentals and bearish technicals are leading further indecision in the grain complex.
The latest update on South American weather has a drier forecast across Southern Brazil while weather in Mato Grosso and Argentina remain favorable. The EU & GFS remain in agreement that Brazil’s monsoon continues to perform normally into the middle part of April across key areas of northern Brazil. Warmth/dryness pushes maturity and speeds harvest along in Argentina. The only area of concern at present is that of deepening drought across the southern third of Brazil’s safrinha Corn Belt. 10-day cumulative rainfall of 2-4” impacts Mato Grosso do Sul and Goias in Brazil. Moderate rain sneaks into northern Mato Grosso do Sul but does not reach major crop areas there – and a pattern of complete dryness is offered to Parana – which accounts for 15% of Brazilian safrinha production. Projected subsoil anomalies remain in place. Surplus moisture will be present in Mato Grosso do Sul and Parana. It remains the story of the haves and have nots. USDA will be forced to trim it’s Brazilian corn production estimate if rain fails to appear in the south by mid-April. This will add to volatility and price swings. Yesterday’s open interest reflect the doubt in the passion of bulls & bears minds as we seem to be oversold.
In yesterday’s trading session corn open interest fell 828 contracts and soybeans dropped 1,355 contracts, while wheat rose 2,175 contracts. Soybean meal lost 2,161 contracts while soybean oil dropped 1,635 contracts.
Read Full Story »»»
DiscoverGold
|
Followers
|
89
|
Posters
|
|
|
Posts (Today)
|
0
|
Posts (Total)
|
8752
|
|
Created
|
05/01/07
|
Type
|
Free
|
| Moderators DiscoverGold Pro-Life | |||
- The Commodity Bull is Running... Inflation is Running... Harder Living (i.e. FOOD, CLOTHING, SHELTER) is Dead Ahead... -
- Commodity Futures Trading -
http://finviz.com/futures_performance.ashx
Beneficial Educational Resources on Futures TradingThe futures market is volatile, and it cuts both ways. Leverage that makes it profitable can also ruin reckless, undisciplined traders overnight. Most brokers have paper trading available on their platforms, so those who are new to futures should take advantage and learn with these tools before going live with real money. Mitigate risk with stop loss orders at all times, and cut losses quickly instead of adding contracts and attempting to flip your way out of a losing position. Also, use mini instruments when available, with lower margin requirements, until you have sufficient capital to buy and sell more expensive contracts. Even though the potential is there, don't try to make too many profits at once. If things aren't going well, often times quitting for the day and collecting one's thoughts is the best decision. New opportunities come along daily. Markets are open nearly 24 hours, so set a schedule and stick to it. Avoid trading while tired or distracted, and please don't listen to the advice of others. Do research on fundamentals affecting markets as well as paying attention to TA. Watch key indices, and listen to accurate, real-time news during the session to stay aware of shifting trends. Trade smart, trade safely, and have fun.
Videos on Futureshttps://www.youtube.com/playlist?list=PL9A5C5A93D243CA44 Continuous Improvement in Progress |
Commodity Futures Trading
https://www.tdameritrade.com/investment-products/futures-trading.page
| Volume | |
| Day Range: | |
| Bid Price | |
| Ask Price | |
| Last Trade Time: |


