


| Followers | 192 |
| Posts | 41494 |
| Boards Moderated | 1 |
| Alias Born | 10/29/2007 |
Saturday, January 02, 2010 8:24:07 PM
Momentum Candle Trading-200 Pips in One Day!
The trading system by Craig Harris has really gotten me interested this week. Since we're not really doing any trading this week due to the holiday, I've had time to just look around. His system basically asks the question "Are you getting at least 40 pips a day from your current trading method?"
That's how I got started a week or so ago playing with fractals, average price swings, envelopes, etc. It's not a bad system at all. It works out pretty well as long as you learn to take your profits when they present themselves. He normally likes to shoot for 20 pips per trade but that depends a lot on what pair you're trading. Once I experimented a bit, I found out it was better to take 10 to 15 pips when they presented themselves. Basically, take the money and run...LOL!
I've experimented with several different pairs but obviously the more volatile the swings, the bigger the pip gains could be. My old favorite was the Beast, so I decided to turn my attention there. I can get nice pip gains from this pair on longer term charts if my entries are decent. 400 to 500 pips a month is relatively easy if you're willing to be patient and average in if necessary.
As I experimented, I was presented with the same problem we have all experienced...trying to hold too long for more profit. I could do pretty good overall but shorter term charts can swing away from you if you're not careful.
So, I started looking for ways to trade the momentum. You know the old saying..."the trend is your friend". Get in, get out. But, I don't like the idea of trading 1 minute and 5 minute charts...too volatile for me.
I turned to the 15 minute chart that Craig Harris uses for his trading. After a while, I just sat back and watched the price action. Most of us can tell when reversals are coming after a trend comes to an end. It's not that hard. But, I wasn't interested in holding for a long period of time. I was more interested in what could be accomplished on a short term power move.
Once I looked at the Beast for a while (or any pair for that matter), I began to notice that breaks of support and resistance very often turned into nice swings. Not a big surprise there. But I got to thinking...there has to be a way to catch those bigger candle moves when they occur. When a candle shows a reversal after a significant uptrend or downtrend, the price action often consolidates and then reverses. But what constitues a reversal? A lot of times it's not just the fact that the candle changes color.
What I found was that, on a 15 minute chart, the power movement reversal candles happened most often when a candle of a different color exceeded the highs or lows of THE PREVIOUS TWO CANDLES. That's what I mean when I'm talking about breaks of support or resistance.
Let's say we've been watching a nice uptrend on a pair. (Note: I like the Heikin Ashi candles on the Dean Malone setup so I try to stick with those. They work best on this method. So, uptrend candles are blue on this setup.) After quite a few blue candles upward, the upward momentum begins to slow down. Finally, no new highs are being made. Then, the HA candles start to change color. But the question is "How do I know this thing is really going to reverse or just catch it's breath and head back up?"
Watch the price action of the last two blue candles. If you get a red reversal candle, watch to see if it breaks below the lows of the LAST TWO CANDLES. If it does, you've got a momentum candle on your hands. Hop in at the break and ride the candle down for a few pips and then GET OUT. Don't wait to see if it keeps going or not. Get in, get out. Works on any pair.
On the Beast, I applied this method and was very surprised to see that I could nail 50 pip profit runs very regularly. Since the Beast has wilder price swings, it makes sense that momentum candles would yield more pips than other pairs.
I developed some basic rules for trading this method and decided to post them here. I'd like for some of you here to try this method on the demo account and see how it works out for you.
Here are the indicators I'm using along with the settings. It's pretty simple overall...
1. Heikin Ashi candles. I like blue for uptrend and red for downtrend.
2. A simple MA20, smoothed and applied to the close.
3. Stochastic Oscillator Craig Harris uses with 8.3.3 settings.
4. Traders Dynamic Index indicator. I've blacked out all the indicator lines except for the red and green. It's all I need for this setup. Keep it simple.
Optional Indicators
1. At the top, I still have my envelope setup going. Same settings as before. Period=20, MA method is Simple, Apply to Close, 1% deviation and Shift=0.
2. The tanned dashed lines are something I've been playing with a bit. It's called AsianSession and it shows the high and low of the price action during what Craig calls the Tokyo Channel. The basic idea behind this is that once the Tokyo channel has been defined, many times price action during the remainder of the day will respect the upper and lower boundaries as resistance and support. Not always, but many times it works that way. It kind of gives you a heads up that a reversal may be at hand. Not necessary to have and this method doesn't trade on that indicator but it is nice to see how the market reacted during that session.
Ok, here are the rules. The most import stuff is in bold.
1. We don't trade right at the MA20. Wait for the price action to move away from that level before entering. After a big swing, price action almost always moves back to that level on any time frame. If price action has just touched the MA20 and is moving away AND the indicators agree, then an entry is acceptable. ALL EXITS WILL OCCUR NO LATER THAN THE MA20 IF YOU'RE COMING BACK DOWN FROM ABOVE THE MA20 OR BACK UP FROM BELOW THE MA20. THIS IS EXTREMELY IMPORTANT!
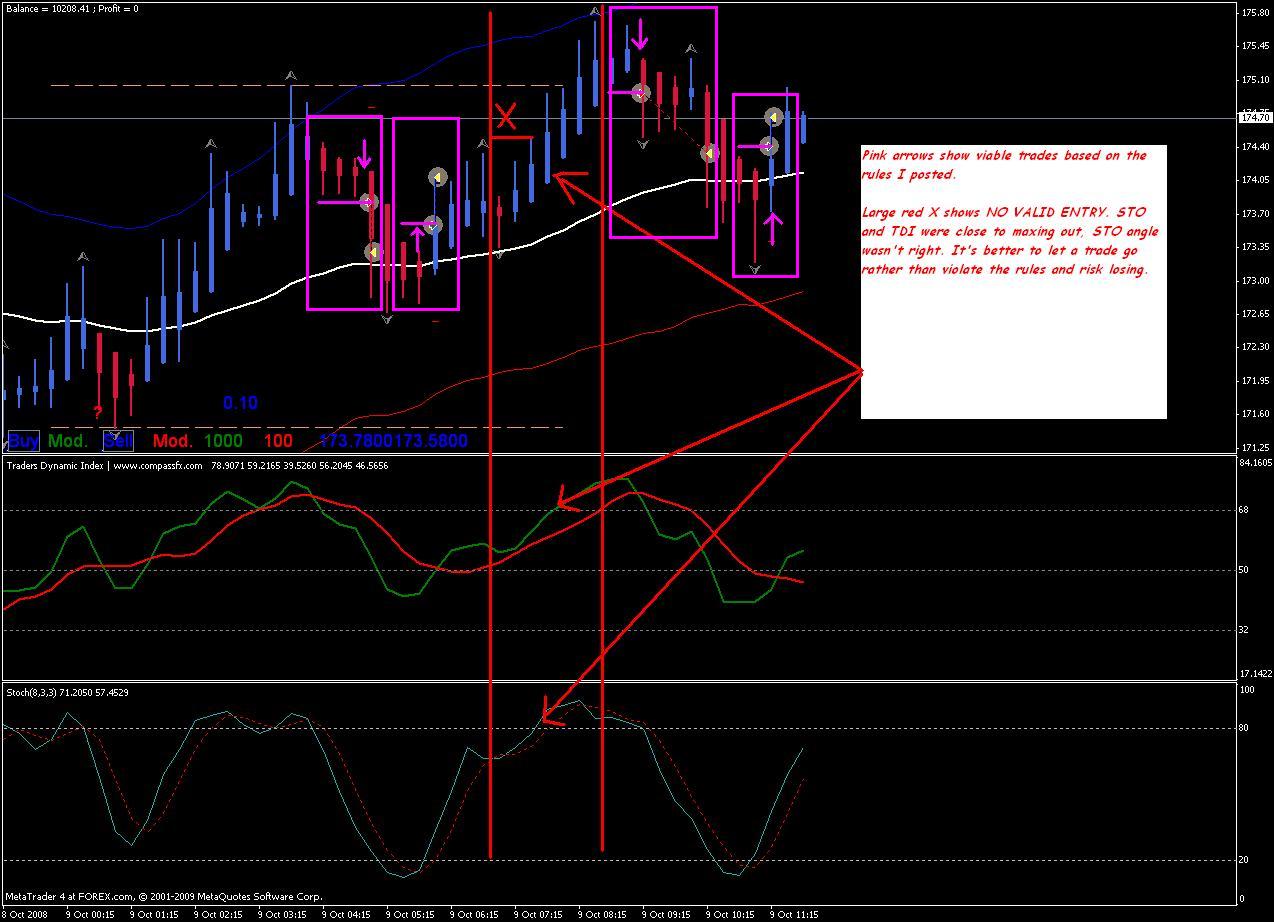
2. The Stochastic oscillator is VERY important. Notice the sharp upward or downward angle of the STO on each of the entries I made on the test chart. THE ANGLE OF THE STOCHASTIC NEEDS TO BE BETWEEN 12:00 AND 2:00 FOR A VALID LONG ENTRY AND BETWEEN 4:00 AND 6:00 FOR A VALID SHORT ENTRY. Also notice that the the Stochastic must be between 80 and 20. Don't enter a trade if you're already close to those levels. And finally, notice that the STO is separated nicely away from the dashed red signal line when the entries occur.
3. Sometimes the TDI will give us a heads up on an entry before the STO confirms it. That's why I have it included in this setup. If green crosses up above red, it helps confirm the long entry. If green goes below red, it helps confirm the short entry. DON'T USE THE TDI AS THE ONLY BASIS FOR ENTERING. PRICE ACTION MUST AGREE!
4. DON'T BE GREEDY! I can't stress this enough. After entering, if you're profitable and the price actions starts to stall and doesn't seem to want to move in your direction any more, THEN GET OUT. Don't hang around to see if it keeps going. I've got one example on the chart where I did this and it worked out but I got lucky. The only reason I stayed in was because the indicators stayed pointed in the right direction. But it didn't yield that many more pips more for taking a BIG risk. DON'T DO IT! Get in and get out. This trading method basically gets you in and out on the SAME CANDLE. You can easily see on the chart where 3 of the 4 entries I made kept going further. But we're not interested in catching all of the move. We just want a piece of it.
5. Use a stop loss. But don't keep the stop loss so tight that you constantly get stopped out only to watch the price action move in the direction you intended. I recommend setting a stop loss slightly above the reversal candle you're going short on or slighly below the reversal candle you're going long on. That seems to work well.
6. DON'T TRADE FOR 30 MINUTES BEFORE AND 30 MINUTES AFTER NEWS ANNOUNCEMENTS! Forex Factory has a nice calendar setup that allows you to set the announcement schedule based on your own time zone. Before you get ready to trade, PRINT OUT a copy of the news schedule. We all know how news can make things go totally nuts in these pairs. STAY AWAY FROM THE NEWS! Here's the website for the calendar I like...
7. Get in and out on the same candle if at all possible. You're riding a momentum wave that may or may not last. Again, if price action stalls, it's time to leave the trade.
http://www.forexfactory.com/
I've also got an area on the chart that shows where I did NOT take a trade. The candle action certainly looked good and it would have been a profitable trade. So, why didn't I enter? Simple...the rules weren't fulfilled. First, the STO angle wasn't sharp enough. It had floated more towards a sideways direction. Second, both the STO and the TDI were reaching high levels. The STO was already above 80 and the TDI was at 68. And finally, the price action was right near the previous daily highs (notice the Tokyo Channel tan lines). All of that combined screams DO NOT ENTER.
That's pretty much it. Please feel free to comment and add to this . This is a group effort and it would be great to have some input to refine the method even further.
The results from the test are posted below the chart. PLEASE NOTICE SOMETHING VERY IMPORTANT!!! Except for the one trade that I stayed in for an hour when I shouldn't have, each trade ONLY LASTED ABOUT FIVE MINUTES! The trick is to wait and LET THE SETUP COME TO YOU. Don't chase it and don't take chances. So, from 5 in the morning till about noon on the tester, I found 4 trades I liked that fit the rules. I could have quit the first hour and had 100 pips in my pocket. I just wanted to move forward further to make sure it wasn't a fluke. That's why there's such a gap between the first two trades and the last two.

The trading system by Craig Harris has really gotten me interested this week. Since we're not really doing any trading this week due to the holiday, I've had time to just look around. His system basically asks the question "Are you getting at least 40 pips a day from your current trading method?"
That's how I got started a week or so ago playing with fractals, average price swings, envelopes, etc. It's not a bad system at all. It works out pretty well as long as you learn to take your profits when they present themselves. He normally likes to shoot for 20 pips per trade but that depends a lot on what pair you're trading. Once I experimented a bit, I found out it was better to take 10 to 15 pips when they presented themselves. Basically, take the money and run...LOL!
I've experimented with several different pairs but obviously the more volatile the swings, the bigger the pip gains could be. My old favorite was the Beast, so I decided to turn my attention there. I can get nice pip gains from this pair on longer term charts if my entries are decent. 400 to 500 pips a month is relatively easy if you're willing to be patient and average in if necessary.
As I experimented, I was presented with the same problem we have all experienced...trying to hold too long for more profit. I could do pretty good overall but shorter term charts can swing away from you if you're not careful.
So, I started looking for ways to trade the momentum. You know the old saying..."the trend is your friend". Get in, get out. But, I don't like the idea of trading 1 minute and 5 minute charts...too volatile for me.
I turned to the 15 minute chart that Craig Harris uses for his trading. After a while, I just sat back and watched the price action. Most of us can tell when reversals are coming after a trend comes to an end. It's not that hard. But, I wasn't interested in holding for a long period of time. I was more interested in what could be accomplished on a short term power move.
Once I looked at the Beast for a while (or any pair for that matter), I began to notice that breaks of support and resistance very often turned into nice swings. Not a big surprise there. But I got to thinking...there has to be a way to catch those bigger candle moves when they occur. When a candle shows a reversal after a significant uptrend or downtrend, the price action often consolidates and then reverses. But what constitues a reversal? A lot of times it's not just the fact that the candle changes color.
What I found was that, on a 15 minute chart, the power movement reversal candles happened most often when a candle of a different color exceeded the highs or lows of THE PREVIOUS TWO CANDLES. That's what I mean when I'm talking about breaks of support or resistance.
Let's say we've been watching a nice uptrend on a pair. (Note: I like the Heikin Ashi candles on the Dean Malone setup so I try to stick with those. They work best on this method. So, uptrend candles are blue on this setup.) After quite a few blue candles upward, the upward momentum begins to slow down. Finally, no new highs are being made. Then, the HA candles start to change color. But the question is "How do I know this thing is really going to reverse or just catch it's breath and head back up?"
Watch the price action of the last two blue candles. If you get a red reversal candle, watch to see if it breaks below the lows of the LAST TWO CANDLES. If it does, you've got a momentum candle on your hands. Hop in at the break and ride the candle down for a few pips and then GET OUT. Don't wait to see if it keeps going or not. Get in, get out. Works on any pair.
On the Beast, I applied this method and was very surprised to see that I could nail 50 pip profit runs very regularly. Since the Beast has wilder price swings, it makes sense that momentum candles would yield more pips than other pairs.
I developed some basic rules for trading this method and decided to post them here. I'd like for some of you here to try this method on the demo account and see how it works out for you.
Here are the indicators I'm using along with the settings. It's pretty simple overall...
1. Heikin Ashi candles. I like blue for uptrend and red for downtrend.
2. A simple MA20, smoothed and applied to the close.
3. Stochastic Oscillator Craig Harris uses with 8.3.3 settings.
4. Traders Dynamic Index indicator. I've blacked out all the indicator lines except for the red and green. It's all I need for this setup. Keep it simple.
Optional Indicators
1. At the top, I still have my envelope setup going. Same settings as before. Period=20, MA method is Simple, Apply to Close, 1% deviation and Shift=0.
2. The tanned dashed lines are something I've been playing with a bit. It's called AsianSession and it shows the high and low of the price action during what Craig calls the Tokyo Channel. The basic idea behind this is that once the Tokyo channel has been defined, many times price action during the remainder of the day will respect the upper and lower boundaries as resistance and support. Not always, but many times it works that way. It kind of gives you a heads up that a reversal may be at hand. Not necessary to have and this method doesn't trade on that indicator but it is nice to see how the market reacted during that session.
Ok, here are the rules. The most import stuff is in bold.
1. We don't trade right at the MA20. Wait for the price action to move away from that level before entering. After a big swing, price action almost always moves back to that level on any time frame. If price action has just touched the MA20 and is moving away AND the indicators agree, then an entry is acceptable. ALL EXITS WILL OCCUR NO LATER THAN THE MA20 IF YOU'RE COMING BACK DOWN FROM ABOVE THE MA20 OR BACK UP FROM BELOW THE MA20. THIS IS EXTREMELY IMPORTANT!
2. The Stochastic oscillator is VERY important. Notice the sharp upward or downward angle of the STO on each of the entries I made on the test chart. THE ANGLE OF THE STOCHASTIC NEEDS TO BE BETWEEN 12:00 AND 2:00 FOR A VALID LONG ENTRY AND BETWEEN 4:00 AND 6:00 FOR A VALID SHORT ENTRY. Also notice that the the Stochastic must be between 80 and 20. Don't enter a trade if you're already close to those levels. And finally, notice that the STO is separated nicely away from the dashed red signal line when the entries occur.
3. Sometimes the TDI will give us a heads up on an entry before the STO confirms it. That's why I have it included in this setup. If green crosses up above red, it helps confirm the long entry. If green goes below red, it helps confirm the short entry. DON'T USE THE TDI AS THE ONLY BASIS FOR ENTERING. PRICE ACTION MUST AGREE!
4. DON'T BE GREEDY! I can't stress this enough. After entering, if you're profitable and the price actions starts to stall and doesn't seem to want to move in your direction any more, THEN GET OUT. Don't hang around to see if it keeps going. I've got one example on the chart where I did this and it worked out but I got lucky. The only reason I stayed in was because the indicators stayed pointed in the right direction. But it didn't yield that many more pips more for taking a BIG risk. DON'T DO IT! Get in and get out. This trading method basically gets you in and out on the SAME CANDLE. You can easily see on the chart where 3 of the 4 entries I made kept going further. But we're not interested in catching all of the move. We just want a piece of it.
5. Use a stop loss. But don't keep the stop loss so tight that you constantly get stopped out only to watch the price action move in the direction you intended. I recommend setting a stop loss slightly above the reversal candle you're going short on or slighly below the reversal candle you're going long on. That seems to work well.
6. DON'T TRADE FOR 30 MINUTES BEFORE AND 30 MINUTES AFTER NEWS ANNOUNCEMENTS! Forex Factory has a nice calendar setup that allows you to set the announcement schedule based on your own time zone. Before you get ready to trade, PRINT OUT a copy of the news schedule. We all know how news can make things go totally nuts in these pairs. STAY AWAY FROM THE NEWS! Here's the website for the calendar I like...
7. Get in and out on the same candle if at all possible. You're riding a momentum wave that may or may not last. Again, if price action stalls, it's time to leave the trade.
http://www.forexfactory.com/
I've also got an area on the chart that shows where I did NOT take a trade. The candle action certainly looked good and it would have been a profitable trade. So, why didn't I enter? Simple...the rules weren't fulfilled. First, the STO angle wasn't sharp enough. It had floated more towards a sideways direction. Second, both the STO and the TDI were reaching high levels. The STO was already above 80 and the TDI was at 68. And finally, the price action was right near the previous daily highs (notice the Tokyo Channel tan lines). All of that combined screams DO NOT ENTER.
That's pretty much it. Please feel free to comment and add to this . This is a group effort and it would be great to have some input to refine the method even further.
The results from the test are posted below the chart. PLEASE NOTICE SOMETHING VERY IMPORTANT!!! Except for the one trade that I stayed in for an hour when I shouldn't have, each trade ONLY LASTED ABOUT FIVE MINUTES! The trick is to wait and LET THE SETUP COME TO YOU. Don't chase it and don't take chances. So, from 5 in the morning till about noon on the tester, I found 4 trades I liked that fit the rules. I could have quit the first hour and had 100 pips in my pocket. I just wanted to move forward further to make sure it wasn't a fluke. That's why there's such a gap between the first two trades and the last two.


Join the InvestorsHub Community
Register for free to join our community of investors and share your ideas. You will also get access to streaming quotes, interactive charts, trades, portfolio, live options flow and more tools.

