


| Followers | 679 |
| Posts | 140700 |
| Boards Moderated | 37 |
| Alias Born | 03/10/2004 |
Sunday, January 16, 2022 11:20:09 AM
By: Jim Curry | January 16, 2022
Recap of Last Week
Last week's action saw gold forming its low in Monday's session, here doing so with the tag of the 1789.30 figure. From there, strength was seen into early-day Friday, with the metal pushing up to a peak of 1829.30 - before backing off the same into the daily/weekly close.
Gold's Near-Term View
From the comments made last weekend, the downward phase of the 20-day time cycle was recently seen as in force, with the last short-term bottom expected to come from the same. Here again is that 20-day component:
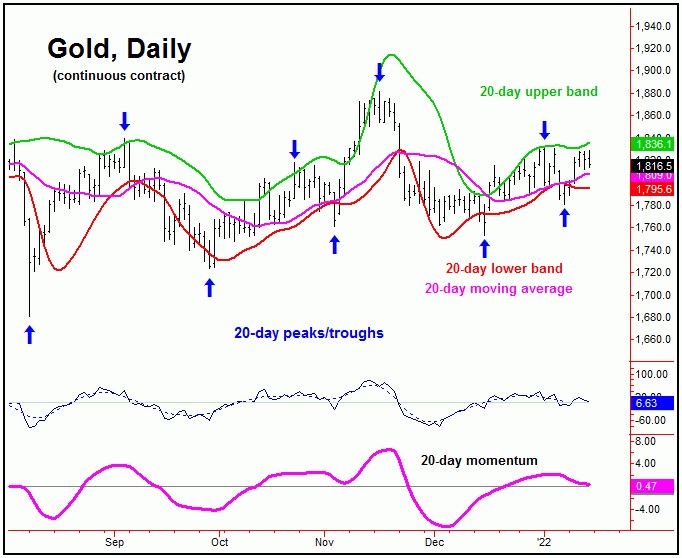
From last weekend: "In terms of time, the most recent upward phase of this (20-day) cycle took 12 trading days before peaking, which is a (bullishly) right-translated wave. With that - along with the fact that the larger 72-day cycle is seen as pointing higher - the probabilities favor a countertrend decline in progress off the 1833.00 swing top. Going further, we are already into the anticipated bottoming window for this 20-day component. Once its next low is set in place, the ideal path is looking for a push back above the 1833.00 figure in the days/weeks ahead, ideally playing out into the mid-January to mid-February timeframe."
With the above said and noted, the last short-term bottom came with this 20-day cycle component, which also ended up as the trough for the smaller 10-day wave. This 10-day cycle is shown on our next chart:
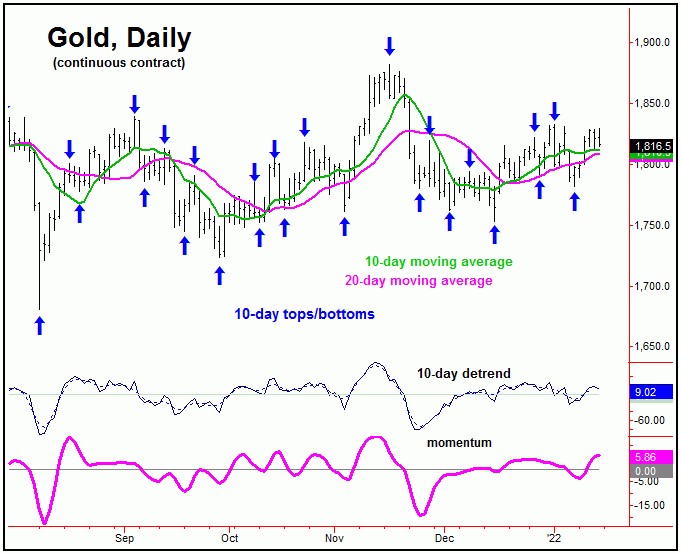
In terms of time, with the upward phase of the 10 and 20-day waves being only 5 days along, the probabilities should favor additional strength in the coming days, ideally with a push back to or above the 1833.00 swing top being seen into this mid-to-late January timeframe. The upper 20-day cycle band (shown on our 20-day cycle chart) will normally act as the upside magnet with this wave, with that upper band currently at the 1836.00 figure (February, 2022 contract) - and rising slightly each day.
Stepping back, if we do manage to see higher highs for the swing in the coming days, we should get our first downside 'reversal point' with the larger 72-day cycle, with the exact details always posted in our Gold Wave Trader report. Here again is that 72-day cycle component:
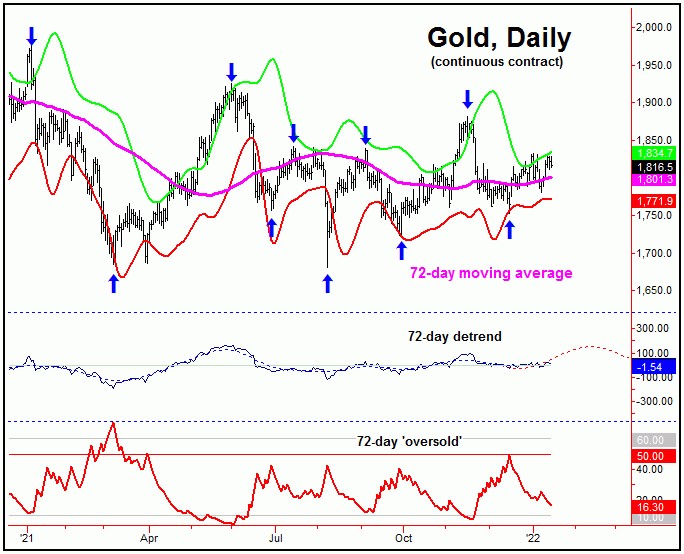
In terms of time, this 72-day cycle is still phased as bullish - ideally pushing higher into the mid-January to mid-February region. There is a particular focus on the latter (February) range to next top this wave, due in part to seasonal considerations.
In terms of technical signals, we might expect to see our 72-day 'oversold' indicator dropping back below its lower reference line as this wave tops, along with a daily close above the upper 72-day cycle band indicator (currently, 1834 and rising). If the combination of these are seen - on the same day - at any point going forward, then the probabilities will favor the metal being close to the next key peak for gold.
Gold Market, Mid-Term Picture
Until proven otherwise, the overall assumption is that the current upward phase of the 72-day wave will remain below the 1882.10 swing top, registered back in November of last year. If correct, the probabilities are above-average that a drop back to the low-end 1600's will be seen into late-Spring of this year, where the next 154 and 310-day cycle trough is projected.
For the bigger picture, key resistance looks to be the 1860-1880 level for the upward phase of this 72-day cycle, though there is no guarantee that gold will halt the rally phase of this wave into the same. However, if it does hold, the odds will favor a drop back to the lower 310-day cycle channel in the months to follow, with that lower 310-day band shown on our next chart:
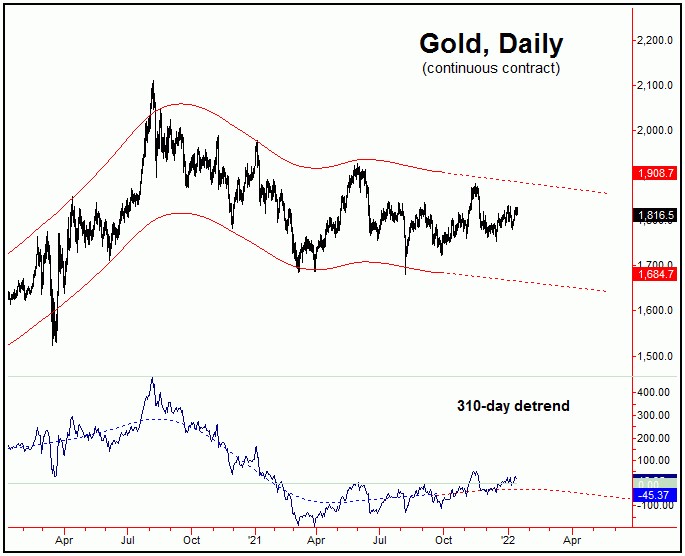
For the bigger picture, the next low for this 310-day cycle should also end up as the trough for a smaller-tracked 154-day wave. In turn, these two waves should also bottom the aforementioned 72-day component.
From whatever low that ends up forming with the 72-day, 154-day and 310-day waves into late-Spring, the largest-percentage rally of this year is expected to be seen in the months to follow. In terms of price, that move higher is favored to be in the range of 15-25% or more, which is the statistical average rally range for a larger 154 and 310-day upward phase. Stay tuned.
Read Full Story »»»
 DiscoverGold
Information posted to this board is not meant to suggest any specific action, but to point out the technical signs that can help our readers make their own specific decisions. Caveat emptor!
• DiscoverGold
Recent GLD News
- Form 10-Q - Quarterly report [Sections 13 or 15(d)] • Edgar (US Regulatory) • 02/08/2024 03:33:22 PM
- Form FWP - Filing under Securities Act Rules 163/433 of free writing prospectuses • Edgar (US Regulatory) • 01/19/2024 05:18:16 PM
- Crypto: RNDR, LINK, CHZ Emerge as Wednesday’s Top Performers, Ethereum Pilots Dencun Update, and More • IH Market News • 01/17/2024 04:51:44 PM
- Form 424I - • Edgar (US Regulatory) • 12/27/2023 04:04:08 PM
- Form FWP - Filing under Securities Act Rules 163/433 of free writing prospectuses • Edgar (US Regulatory) • 12/22/2023 09:02:08 PM
- Form 10-K - Annual report [Section 13 and 15(d), not S-K Item 405] • Edgar (US Regulatory) • 11/22/2023 07:49:08 PM
- Form FWP - Filing under Securities Act Rules 163/433 of free writing prospectuses • Edgar (US Regulatory) • 09/14/2023 02:12:55 PM
- Form 8-K - Current report • Edgar (US Regulatory) • 09/12/2023 08:02:07 PM
- Gold Stabilizes Near One-Month Highs as U.S. Interest Rate Hike Expectations • IH Market News • 08/31/2023 12:43:38 PM
- Gold Closes Higher, With Strong Retreat In Treasury Interest Rates And Dollar Low • IH Market News • 08/29/2023 06:20:49 PM
- Form 10-Q - Quarterly report [Sections 13 or 15(d)] • Edgar (US Regulatory) • 08/07/2023 06:55:27 PM
Coinllectibles' Subsidiary, Grand Town Development Limited, Acquires Rare Song Dynasty Ceramics Worth Over USD28million • COSG • Apr 18, 2024 8:03 AM
ILUS Provides Form 10-K Filing Update • ILUS • Apr 17, 2024 9:54 AM
Glucotrack Announces Expansion of Its Continuous Glucose Monitoring Technology to Epidural Glucose Monitoring • GCTK • Apr 17, 2024 8:00 AM
Maybacks Global Entertainment To Fire Up 24 New Stations in Louisiana • AHRO • Apr 16, 2024 1:30 PM
Cannabix Technologies Begins Certification of Contactless Alcohol Breathalyzer, Re-Brands product series to Breath Logix • BLOZF • Apr 16, 2024 8:52 AM
Kona Gold Beverages, Inc. Acquires Surge Distribution LLC from Loud Beverage Group, Inc. (LBEV) • KGKG • Apr 16, 2024 8:30 AM

