


| Followers | 679 |
| Posts | 140823 |
| Boards Moderated | 36 |
| Alias Born | 03/10/2004 |
Wednesday, November 17, 2021 1:00:15 PM
By: Investing.com | November 17, 2021
On Tuesday, while the broader market, including all four US major indices and even financial sector peers all gained, shares of Citigroup (NYSE:C) slumped.
The stock lost almost 1.5% yesterday, to close at $67.74. It was the equity's second straight day of losses. As well, C closed $12.55 lower than its 52-week high ($80.29), which it hit on June 2, for a 16% loss in value since that time.
It's difficult to understand why shares of a New York City-based global financial services company would decline amid speculation the Fed will raise rates—the bread and butter of lenders—more quickly than expected, pressured by inflation. But other big banks fell too.
Still, Citi's stock lagged. While Wells Fargo (NYSE:WFC) shed almost as much as Citi, with a 1.4% selloff, JPMorgan Chase (NYSE:JPM) dropped by half that, with just a 0.7% retreat. And Bank of America (NYSE:BAC) rose almost 0.1%.
It's not clear why financials tumbled, but perhaps they were swept in by the retreating Reflation Trade over the last few days, as tech growth shares led markets. Or possibly this paradigm is signaling that investors are losing faith in the economic recovery.
Whatever the fundamental case, technicals are providing a picture of weakness.
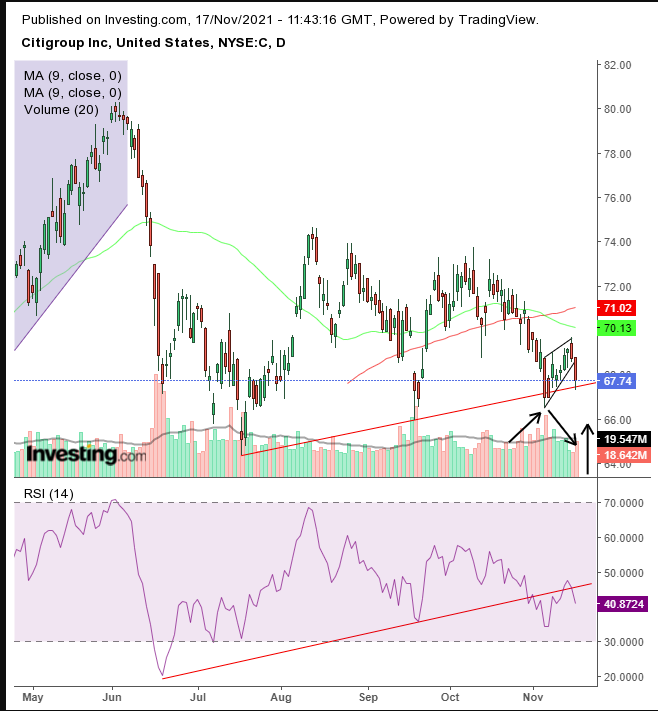
C Daily
The stock is on the cusp of completing an H&S continuation pattern. It may have completed a rising flag yesterday, bearish after a $4.80 drop within just six sessions.
Note how the volume rose alongside the creation of the flagpole—the sharp move before the stock began to range. Then, volume dried up amid the flag's body formation. Finally, the breakout was accompanied by a jump in volume. Volume indicates where participation is, and since Oct. 22, it has been with the bears.
The 50 DMA crossed below the 200 DMA, triggering a Death Cross, a nasty technical indicator, suggesting continued weakening.
The Relative Strength Index fell below its rising trendline, showing a momentum breakdown with the overall rally since July 19. The RSI attempted to climb back above the line but failed. This momentum indicator is famous for providing early calls for breakouts, suggesting our H&S will complete.
We measure an H&S by its height, at its smallest point. Therefore, we measure the pattern from its $74.64 head to the breakout of its right shoulder, by our estimate at around $67.64, forming a $7 minimum objective to about $60.
Trading Strategies
Conservative traders should wait for a downside breakout to $65, with at least a 3-day filter. Then, they'd wait for a return move to retest the resistance.
Moderate traders would wait for penetration to $66 with a two-day filter in order to avoid a bear trap.
Aggressive traders could go short at will, provided they accept the higher risk that goes with moving before the rest of the market, with less confirmation. Money management is crucial.
Read Full Story »»»
 DiscoverGold
Information posted to this board is not meant to suggest any specific action, but to point out the technical signs that can help our readers make their own specific decisions. Caveat emptor!
• DiscoverGold
Recent C News
- Citigroup Announces C$56.782 Million Redemption of 5.160% Fixed Rate / Floating Rate Subordinated Notes due 2027 • Business Wire • 04/24/2024 01:00:00 PM
- Apple Loses Market Share in China, GM Surges in Pre-Market Following Upward Revisions for 2024 Projections, and More News • IH Market News • 04/23/2024 11:25:34 AM
- United Shares Surge 5.3% in Q1 2024 Earnings Beat; Take-Two Cuts 5% of Workforce, and More News • IH Market News • 04/17/2024 10:57:39 AM
- CitiGroup Announces Full Redemption of Series D Preferred Stock • Business Wire • 04/15/2024 08:15:00 PM
- Upbeat Earnings, Retail Sales Data May Generate Buying Interest • IH Market News • 04/15/2024 01:10:16 PM
- U.S. Index Futures Surge after Dow Jones’ Worst Week, Oil Prices Dip • IH Market News • 04/15/2024 11:08:21 AM
- U.S. Stocks Pulling Back Sharply As JPMorgan Chase Disappoints • IH Market News • 04/12/2024 08:21:52 PM
- U.S. Stocks May Move Back To The Downside In Early Trading • IH Market News • 04/12/2024 01:10:09 PM
- Citigroup Reports First Quarter 2024 Results • Business Wire • 04/12/2024 12:00:00 PM
- U.S. Index Futures Indecisive Ahead of Banking Earnings, Oil Prices Surge • IH Market News • 04/12/2024 11:07:01 AM
- Nasdaq Surges To New Record Closing High But Dow Closes Little Changed • IH Market News • 04/11/2024 08:25:37 PM
- Citigroup Announces $2.75 Billion Redemption of 3.352% Fixed Rate / Floating Rate Notes due 2025 • Business Wire • 04/09/2024 08:15:00 PM
- U.S. Futures Dip Ahead of Key Inflation Data and Q1 Earnings Season Kickoff, Oil Prices Decline • IH Market News • 04/08/2024 11:19:03 AM
- Apple Terminates 614 Employees, Disney Unveils June Crackdown on Password Sharing, and More Updates • IH Market News • 04/05/2024 11:38:57 AM
- Citigroup Declares Common Stock Dividend; Citigroup Declares Preferred Dividends • Business Wire • 04/03/2024 08:28:00 PM
- Cal-Maine Surges on Strong Quarterly Performance, Taiwan Earthquake Disrupts Tech Supply Chain, and More • IH Market News • 04/03/2024 11:12:20 AM
- GameStop Shares Tumble 20% in Pre-Market Trading Amid Revenue Decline, Direct Digital Plummets 42%, and More News • IH Market News • 03/27/2024 10:54:47 AM
- Citigroup Global Markets Holdings Inc. – Issue of EUR 375,000,000 Cash Settled Exchangeable Bonds due April 2029 Referable to the Shares of LVMH Moet Hennessy Louis Vuitton • Business Wire • 03/27/2024 07:45:00 AM
- Super Micro Computer and Seagate Shares Surge on Analyst Optimism in Pre-Market Trading, and Latest News • IH Market News • 03/26/2024 11:20:49 AM
- Apple Pre-Market Drop Due to Antitrust Threats, Surprising Profit Boosts Micron Shares, and Latest Market Updates • IH Market News • 03/21/2024 11:17:26 AM
- Crypto: Bitcoin Plummets, Grayscale Promises Lower Fees, and Latest News • IH Market News • 03/19/2024 05:16:16 PM
- Adobe Stock Drops Following Below-Estimate Projections, Cardlytics Surges with Unexpected Profit, and More News • IH Market News • 03/15/2024 11:30:55 AM
- Intel Loses Pentagon Funding, Shell Plans 20% Business Team Reduction, and Latest News • IH Market News • 03/13/2024 11:02:03 AM
- Oracle Soars 13% With Exceptional Growth and Boosts Nvidia Shares With Collaboration Announcement, and More • IH Market News • 03/12/2024 11:21:35 AM
- Form FWP - Filing under Securities Act Rules 163/433 of free writing prospectuses • Edgar (US Regulatory) • 03/11/2024 09:28:41 PM
Axis Technologies Group and Carbonis Forge Ahead with New Digital Carbon Credit Technology • AXTG • Apr 24, 2024 3:00 AM
North Bay Resources Announces Successful Equipment Test at Bishop Gold Mill, Inyo County, California • NBRI • Apr 23, 2024 9:41 AM
Epazz, Inc.: CryObo, Inc. solar Bitcoin operations will issue tokens • EPAZ • Apr 23, 2024 9:20 AM
Avant Technologies Launches Advanced AI Supercomputing Network and Expansive Data Solutions • AVAI • Apr 23, 2024 8:00 AM
BestGrowthStocks.com Issues Comprehensive Analysis of Triller Merger with AGBA Group Holding Limited • AGBA • Apr 22, 2024 1:00 PM
Cannabix Technologies to Present Marijuana Breathalyzer Technology at International Association for Chemical Testing (IACT) Conference in California • BLO • Apr 22, 2024 8:49 AM

