Wednesday, February 24, 2021 3:16:31 AM
Targets 0.0020 / 0.0023 / 0.0050 / 0.0080 / $0.010
http://www.allotcbb.com/quote.php?symbol=ICBT
I'll Alert you of stocks to Buy,
before the Run happens !
________________________________________________________________
ICBT Security Details
Share Structure
Market Value1..........$1,699,034 a/o Feb 23, 2021
Authorized Shares..2,200,000,000 a/o Feb 23, 2021
Outstanding Shares.2,123,792,434 a/o Feb 23, 2021
-Restricted................25,261,733 a/o Feb 23, 2021
-Unrestricted...........2,098,530,701 a/o Feb 23, 2021
Held at DTC.............1,106,324,366 a/o Feb 23, 2021
Float..............Not Available
Par Value
https://www.otcmarkets.com/stock/ICBT/security
https://www.otcmarkets.com/stock/ICBT/news
https://www.otcmarkets.com/stock/ICBT/disclosure
________________________________________________________________
How Targets are Calculated
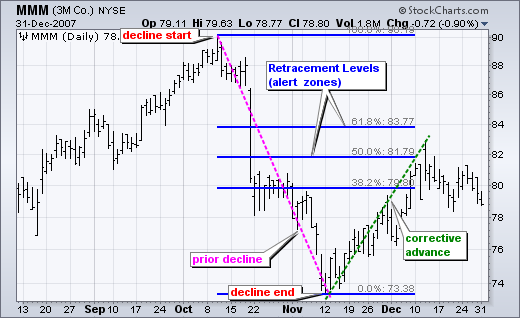
Fibonacci Numbers and Retrace Targets: Explained
________________________________________________________________
Fibonacci Numbers
http://www.stockta.com/cgi-bin/school.pl?page=fib
Fibonacci Retracements
* Golden 61.8% Retracements
* Moderate 38.2% Retracements
* Common 38.2% Retracements
Fibonacci Retracements
http://stockcharts.com/school/doku.php?id=chart_school:chart_analysis:fibonacci_retracemen
________________________________________________________________
Fibonacci Numbers
are commonly used in Technical Analysis
with or without a knowledge of Elliot Wave Analysis
to determine potential support, resistance,
and price objectives.
The most popular Fibonacci Retracements are
61.8% and 38.2%
61.8% retracements
imply a new trend is establishing itself.
38.2% retracements
usually imply that the prior trend will continue
38.2% retracements
are considered natural retracements in a healthy trend.
Fibonacci Retracements
can be applied after a decline
to forecast the length of a counter-trend bounce.
________________________________________________________________
The 50% retracement is not based on a Fibonacci number.
Instead, this number stems from Dow Theory's assertion
that the Averages often retrace half their prior move.
50% retracement
implies indecision.
________________________________________________________________
________________________________________________________________
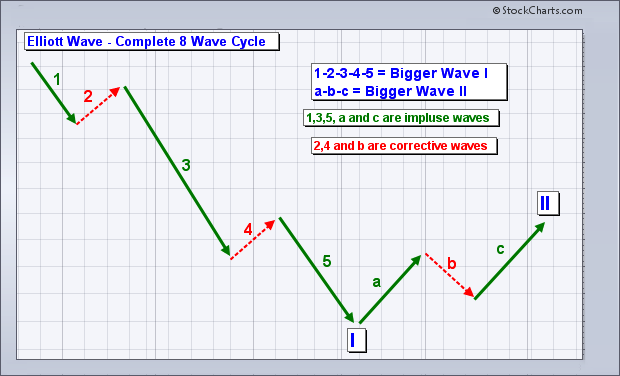
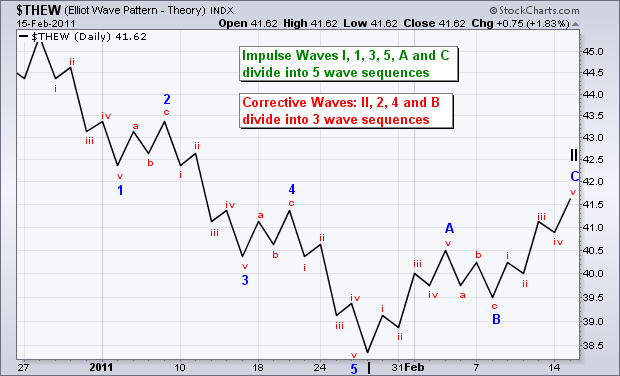
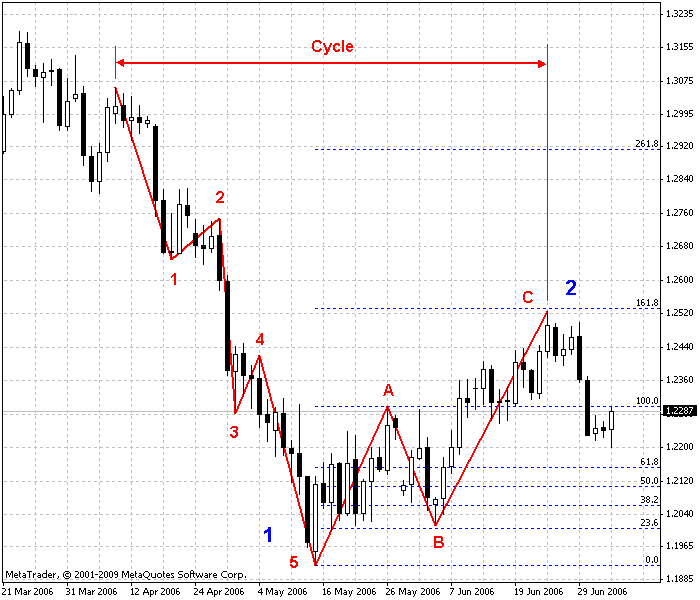
Buy after an Elliott Wave 5-Wave Decline
_________________________________________________________________
________________________________________________________________
Buy after an Elliott Wave 5-Wave Decline


Live! Charts
________________________________________________________________
Buy after an Elliott Wave 5-Wave Decline


Live! Charts
________________________________________________________________
Buy after an Elliott Wave 5-Wave Decline


Live! Charts
________________________________________________________________
Buy after an Elliott Wave 5-Wave Decline


Live! Charts
________________________________________________________________
Buy after an Elliott Wave 5-Wave Decline


Live! Charts
________________________________________________________________
Buy after an Elliott Wave 5-Wave Decline


Live! Charts
________________________________________________________________
Buy after an Elliott Wave 5-Wave Decline


Live! Charts
________________________________________________________________
Buy after an Elliott Wave 5-Wave Decline


Live! Charts
________________________________________________________________
Buy after an Elliott Wave 5-Wave Decline


Live! Charts
________________________________________________________________
Buy after an Elliott Wave 5-Wave Decline


Live! Charts
________________________________________________________________
Buy after an Elliott Wave 5-Wave Decline


Live! Charts
________________________________________________________________
Buy after an Elliott Wave 5-Wave Decline


Live! Chart
________________________________________________________________
Buy after an Elliott Wave 5-Wave Decline


Live! Charts
________________________________________________________________
Buy after an Elliott Wave 5-Wave Decline


Live! Charts
________________________________________________________________
Buy after an Elliott Wave 5-Wave Decline


Live! Charts
________________________________________________________________

Axis Technologies Group and Carbonis Forge Ahead with New Digital Carbon Credit Technology • AXTG • Apr 24, 2024 3:00 AM
North Bay Resources Announces Successful Equipment Test at Bishop Gold Mill, Inyo County, California • NBRI • Apr 23, 2024 9:41 AM
Epazz, Inc.: CryObo, Inc. solar Bitcoin operations will issue tokens • EPAZ • Apr 23, 2024 9:20 AM
Avant Technologies Launches Advanced AI Supercomputing Network and Expansive Data Solutions • AVAI • Apr 23, 2024 8:00 AM
BestGrowthStocks.com Issues Comprehensive Analysis of Triller Merger with AGBA Group Holding Limited • AGBA • Apr 22, 2024 1:00 PM
Cannabix Technologies to Present Marijuana Breathalyzer Technology at International Association for Chemical Testing (IACT) Conference in California • BLO • Apr 22, 2024 8:49 AM


