


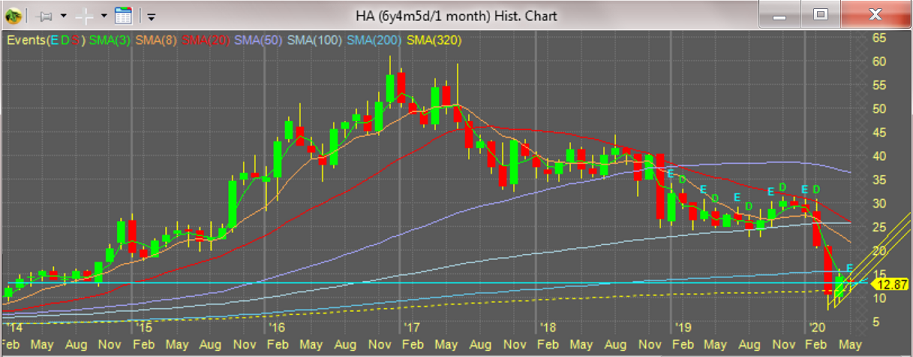
For a stock chart showing high counts of support and resistance levels at current prices, I had to use a monthly chart to get an image that could more easily be seen and show their ultimate origin many years ago. That is shown in the top chart. My purpose is to show the historical origin of resistance levels at current price levels. It originated in 2014 and is currently being retested during the last several weeks. It's conceivable that HA will soon trade around that $15 level over the next few weeks. That was my motive to trade HA now.
I wouldn't get all hung up because the latest monthly candle in the monthly chart is red. In my opinion, a monthly chart in a volatile market (the type we're in) is worthless. Depending on choice of self-manipulation, one could look at a weekly chart instead, and it will show that the last week was tall and green. But I don't look at those either.
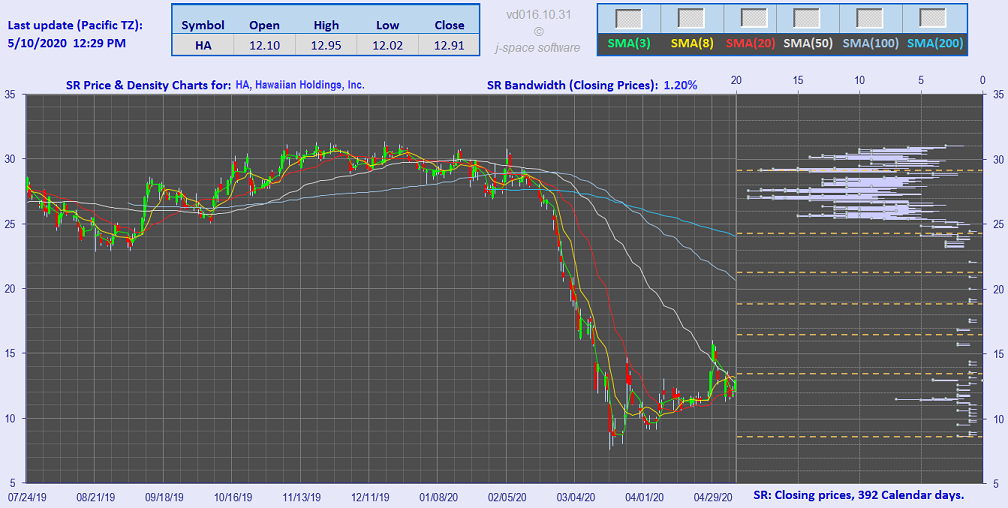
The bottom line for HA is: for support and resistance levels, one needs to only look back over the last several months. That is shown in the bottom chart.
History tends to repeat itself, so we will have to wait and see if HA will continue rising from here or if it has long-term memory of stalling out at $15, the level it held in 2014.
My personal stock trading method would not suffer from a stalled market (such as shown in 2014). That is because my current trading method is to make continual use of Buy-Writes, a CC (Covered-Call) strategy. That method works very well in stalled markets -- buy the stock, sell its Calls; wash, rinse, repeat every week.
The one thing I don't like about HA? It only has monthly options.
That could very well limit my stay here. While I have years of experience doing weekly CC trades, I have no experience doing monthly CC trades. Maybe the only difference with monthly Calls is that I have more opportunities to trade in and out of those Calls.
Speaking of stalled markets: notice how HA frequently stalls out during most years. That's not good for long-term investors, but it's great for traders.
Long-term price history:
Short-term price history and SR levels (over the last several months):
Recent HA News
- Hawaiian Holdings Reports 2024 First Quarter Financial Results • PR Newswire (US) • 04/23/2024 08:01:00 PM
- Hawaiian Holdings Announces 2024 First Quarter Financial Results Conference Call • PR Newswire (US) • 04/09/2024 08:01:00 PM
- Universal Technical Institute and Hawaiian Airlines partner on career opportunities for airframe and powerplant program graduates • PR Newswire (US) • 03/05/2024 09:15:00 PM
- Form 8-K - Current report • Edgar (US Regulatory) • 02/20/2024 11:04:07 AM
- Form 10-K - Annual report [Section 13 and 15(d), not S-K Item 405] • Edgar (US Regulatory) • 02/15/2024 10:21:21 PM
- Form 4 - Statement of changes in beneficial ownership of securities • Edgar (US Regulatory) • 02/13/2024 12:04:25 AM
- Form 4 - Statement of changes in beneficial ownership of securities • Edgar (US Regulatory) • 02/13/2024 12:02:49 AM
- Form 4 - Statement of changes in beneficial ownership of securities • Edgar (US Regulatory) • 02/13/2024 12:00:30 AM
- Form 4 - Statement of changes in beneficial ownership of securities • Edgar (US Regulatory) • 02/12/2024 11:58:35 PM
- Form 4 - Statement of changes in beneficial ownership of securities • Edgar (US Regulatory) • 02/12/2024 11:56:34 PM
- Form 4 - Statement of changes in beneficial ownership of securities • Edgar (US Regulatory) • 02/12/2024 11:54:23 PM
- Form 8-K - Current report • Edgar (US Regulatory) • 02/07/2024 09:05:26 PM
- Form DEFR14A - Revised definitive proxy soliciting materials • Edgar (US Regulatory) • 02/06/2024 10:24:27 PM
- Form 8-K - Current report • Edgar (US Regulatory) • 01/30/2024 09:01:55 PM
- Hawaiian Holdings Reports 2023 Fourth Quarter and Full Year Financial Results • PR Newswire (US) • 01/30/2024 09:01:00 PM
- Form SC 13G/A - Statement of acquisition of beneficial ownership by individuals: [Amend] • Edgar (US Regulatory) • 01/24/2024 07:27:14 PM
- Hawaiian Airlines Boosts Summer Schedule • PR Newswire (US) • 01/22/2024 06:00:00 PM
- Sabre and Hawaiian Airlines sign new distribution agreement that will provide NDC content to Sabre-connected agencies • PR Newswire (US) • 01/18/2024 10:45:00 PM
- Hawaiian Holdings Announces 2023 Fourth Quarter and Full Year Financial Results Conference Call • PR Newswire (US) • 01/16/2024 09:01:00 PM
- Kuehn Law Encourages PXD, IMGN, HA and ICVX Investors to Contact Law Firm • PR Newswire (US) • 01/12/2024 04:10:00 PM
- Form SC 13G - Statement of acquisition of beneficial ownership by individuals • Edgar (US Regulatory) • 01/10/2024 09:57:05 PM
- Form DEFM14A - Definitive proxy statement relating to merger or acquisition • Edgar (US Regulatory) • 01/09/2024 11:04:31 AM
- Kuehn Law Encourages CERE, HA, IMGN, and WAVD Investors to Contact Law Firm • PR Newswire (US) • 01/02/2024 11:10:00 PM
- Form PREM14A - Preliminary proxy statements relating to merger or acquisition • Edgar (US Regulatory) • 12/28/2023 10:15:12 PM
- Form 4 - Statement of changes in beneficial ownership of securities • Edgar (US Regulatory) • 12/27/2023 01:38:16 AM
FEATURED Cannabix's Breath Logix Alcohol Device Delivers Positive Impact to Private Monitoring Agency in Montana, USA • Apr 25, 2024 8:52 AM
Bantec Reports an Over 50 Percent Increase in Sales and Profits in Q1 2024 from Q1 2023 • BANT • Apr 25, 2024 10:00 AM
Kona Gold Beverages, Inc. Announces Name Change to NuVibe, Inc. and Initiation of Ticker Symbol Application Process • KGKG • Apr 25, 2024 8:30 AM
Axis Technologies Group and Carbonis Forge Ahead with New Digital Carbon Credit Technology • AXTG • Apr 24, 2024 3:00 AM
North Bay Resources Announces Successful Equipment Test at Bishop Gold Mill, Inyo County, California • NBRI • Apr 23, 2024 9:41 AM
Epazz, Inc.: CryObo, Inc. solar Bitcoin operations will issue tokens • EPAZ • Apr 23, 2024 9:20 AM

