


| Followers | 679 |
| Posts | 140708 |
| Boards Moderated | 37 |
| Alias Born | 03/10/2004 |
Friday, January 10, 2020 4:11:35 PM
By: Bespoke Investment Group | January 8, 2020
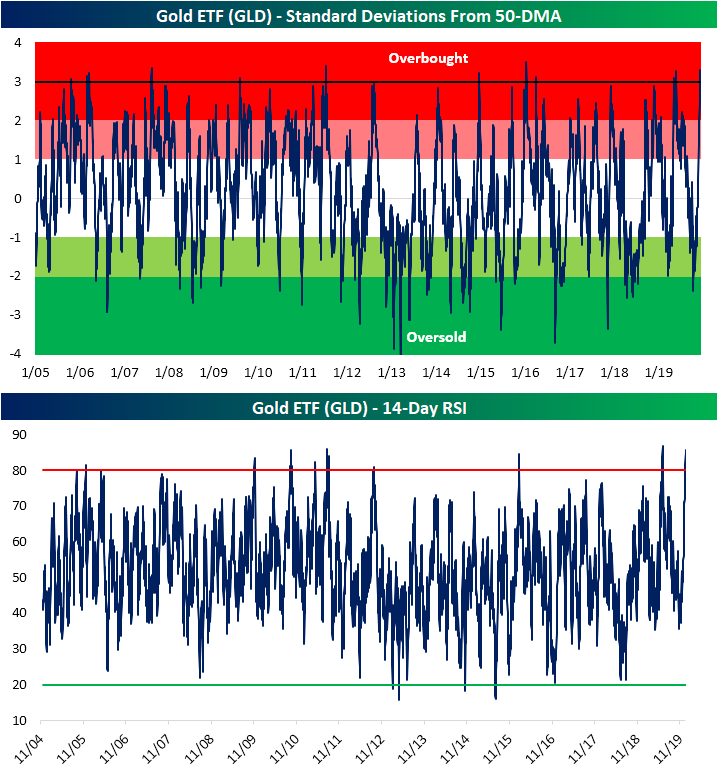
At the end of December, we highlighted in a Chart of the Day that gold was entering 2020 with a bullish technical backdrop. After sitting in a downtrend since its peak set in early September, GLD had begun to break out on December 23rd. Since then it has rallied 5.7% fueled by a shift towards safe-haven assets as geopolitical tensions have built with the Middle East. In the past few days, GLD has experienced yet another breakout taking out the September 4th closing high of $146.66.

Although it has held above these levels so far, the rapid rise of the yellow metal in the past few weeks has led it to be extremely overbought by multiple measures. This means there is likely to be some form of mean reversion in the near future testing the sustainability of the most recent breakout. As shown in the chart below, yesterday's close over a dollar above the September high has led GLD to now sit over 3 standard deviations above its 50-DMA. That is the first time it has done so since June, and before that, you would have to go all the way back to April 2016 to find a time GLD was as extended by that measure.
Similarly, another overbought/oversold indicator, the 14-day RSI, is echoing the extreme readings. While readings above 70 typically indicate that an asset is running hot, the current reading is now over 85! While there have only been a handful of times since the ETF first began trading that the RSI has tipped above 80, readings above 85 are even rarer. Similar to the price in regards to the 50-DMA, the last time things got this extended were in June of 2019. Prior to that, there have only been two other times the RSI has been 85 or greater: once in 2010 and again in 2011.
Read Full Story »»»
 DiscoverGold
Information posted to this board is not meant to suggest any specific action, but to point out the technical signs that can help our readers make their own specific decisions. Caveat emptor!
• DiscoverGold
Recent GOLD News
- Barrick On Track to Achieve 2024 Targets • GlobeNewswire Inc. • 04/16/2024 11:00:00 AM
- Notice of Release of Barrick’s First Quarter 2024 Results • GlobeNewswire Inc. • 04/09/2024 11:00:00 AM
- Strategy-Driven Barrick Builds on Value Foundation • GlobeNewswire Inc. • 03/28/2024 09:20:38 PM
- Barrick Hunts New Gold and Copper Prospects in DRC From Kibali Base • GlobeNewswire Inc. • 03/20/2024 02:00:00 PM
- Barrick Opens Academy at Closed Buzwagi Mine • GlobeNewswire Inc. • 03/18/2024 08:00:00 AM
- Barrick to Grow Production and Value on Global Asset Foundation • GlobeNewswire Inc. • 03/15/2024 11:53:01 AM
- Loulo-Gounkoto Delivers Another Value-Creating Performance • GlobeNewswire Inc. • 03/10/2024 10:00:00 AM
- Passing of the Right Honorable Brian Mulroney • GlobeNewswire Inc. • 03/02/2024 01:17:35 AM
- Kibali and DRC Partner to Promote Local Content • GlobeNewswire Inc. • 03/01/2024 02:22:43 PM
- Tanzanian Parliamentary Committee Lauds Barrick’s Work at North Mara • GlobeNewswire Inc. • 02/23/2024 12:00:00 PM
- Form 6-K - Report of foreign issuer [Rules 13a-16 and 15d-16] • Edgar (US Regulatory) • 02/14/2024 10:28:08 PM
- Form 6-K - Report of foreign issuer [Rules 13a-16 and 15d-16] • Edgar (US Regulatory) • 02/14/2024 08:05:25 PM
- Clear Strategies and Strong Partnerships Set Barrick Up to Outperform, Says Bristow • GlobeNewswire Inc. • 02/14/2024 11:00:00 AM
- Barrick Announces New Share Buyback Program • GlobeNewswire Inc. • 02/14/2024 10:59:00 AM
- Barrick Declares Q4 Dividend • GlobeNewswire Inc. • 02/14/2024 10:58:00 AM
- NGM Strongly Positioned for Growth • GlobeNewswire Inc. • 02/10/2024 01:00:16 AM
- Form SC 13G - Statement of acquisition of beneficial ownership by individuals • Edgar (US Regulatory) • 02/08/2024 03:03:08 PM
- Form 6-K - Report of foreign issuer [Rules 13a-16 and 15d-16] • Edgar (US Regulatory) • 02/08/2024 12:46:55 PM
- Geologically Driven Asset Management Delivers Barrick’s Third Successive Year of Reserve Growth at Sustained Quality, While Unlocking Embedded Growth Portfolio • GlobeNewswire Inc. • 02/08/2024 12:00:00 PM
- Form SC 13G/A - Statement of acquisition of beneficial ownership by individuals: [Amend] • Edgar (US Regulatory) • 02/01/2024 06:04:56 PM
- Africa’s Largest Gold Mine Now Also One of Its Greenest • GlobeNewswire Inc. • 01/29/2024 04:00:00 PM
- Barrick Continues to be a Major Value Creator for Mali • GlobeNewswire Inc. • 01/27/2024 09:00:00 AM
- Barrick’s Lumwana Super Pit Project On Track for First Production in 2028 • GlobeNewswire Inc. • 01/23/2024 03:35:00 PM
- Barrick’s Tanzanian Mines on Tier One Track With Potential for Extending Lives, Growing Production • GlobeNewswire Inc. • 01/21/2024 12:00:00 PM
- New Airport Terminal at Kahama Airstrip to Leave Lasting Legacy at Barrick’s Buzwagi Gold Mine • GlobeNewswire Inc. • 01/21/2024 08:00:00 AM
VPR Brands LP Reports Record Annual Financial Performance for Fiscal Year 2023 • VPRB • Apr 19, 2024 11:24 AM
Coinllectibles' Subsidiary, Grand Town Development Limited, Acquires Rare Song Dynasty Ceramics Worth Over USD28million • COSG • Apr 18, 2024 8:03 AM
ILUS Provides Form 10-K Filing Update • ILUS • Apr 17, 2024 9:54 AM
Glucotrack Announces Expansion of Its Continuous Glucose Monitoring Technology to Epidural Glucose Monitoring • GCTK • Apr 17, 2024 8:00 AM
Maybacks Global Entertainment To Fire Up 24 New Stations in Louisiana • AHRO • Apr 16, 2024 1:30 PM
Cannabix Technologies Begins Certification of Contactless Alcohol Breathalyzer, Re-Brands product series to Breath Logix • BLOZF • Apr 16, 2024 8:52 AM

