


| Followers | 679 |
| Posts | 140700 |
| Boards Moderated | 37 |
| Alias Born | 03/10/2004 |
Friday, October 04, 2019 4:01:06 PM
Why I Watch the COT Report
By: Tim Taschler | September 30, 2019
* (Click Read Full Story »»» at the bottom of the page for the charts to appear on the post)
I got my start in the markets as a floor trader on the Chicago Board of Options Exchange (CBOE) and Chicago Board of Trade (CBOT) in 1986. Since those early days on the floor, I've paid close attention to the Commitment of Traders Report (COT) that comes out every Friday. Why? Because unlike newsletters and talking heads on TV, the COT report is about people putting down millions of dollars of real money on a position.
The COT tracks three groups. The first group, small specs, is comprised of people like you and me, who might trade a few futures contracts, while the second group, the large specs, are hedge funds and CTAs (Commodity Trading Advisor). The third group, often referred to as the “smart money,” is comprised of those who use the futures market to primarily hedge their business activities. Examples of commercials in wheat would include farmers, silo operators and bread makers, so we are looking at trades by the likes of Cargill, Archer Daniels Midland, Bunge, Kraft, Pillsbury and General Mills. As should be obvious, these commercial players know their industry, as they have been in business for decades and understand the market trends - supply and demand - that affect their business (hence the “smart money” designation).
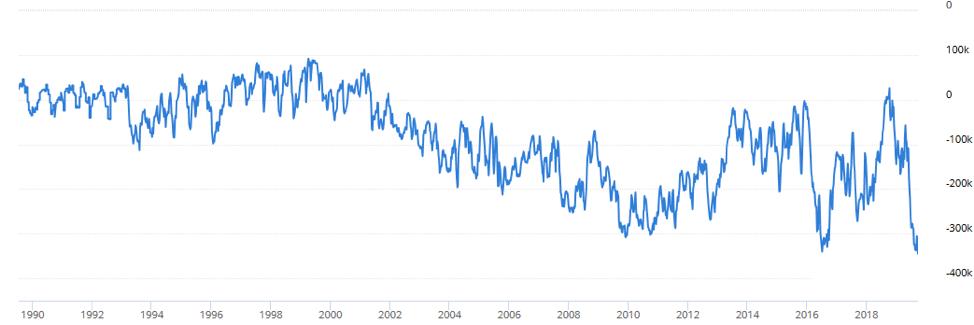
The COT data is released every Friday at 3:30 pm ET and can be found on the CFTC website. You can chart the COT data on the CME website or at Barchart. Alternatively, you can simply download the CFTC data and build your own chart in Excel, like this one (data CTFC, 9/27/19):
You can also track the COT versus price on your StockCharts chart with some simple annotations, as my gold chart shows here (courtesy of StockCharts.com, 9/29/19):
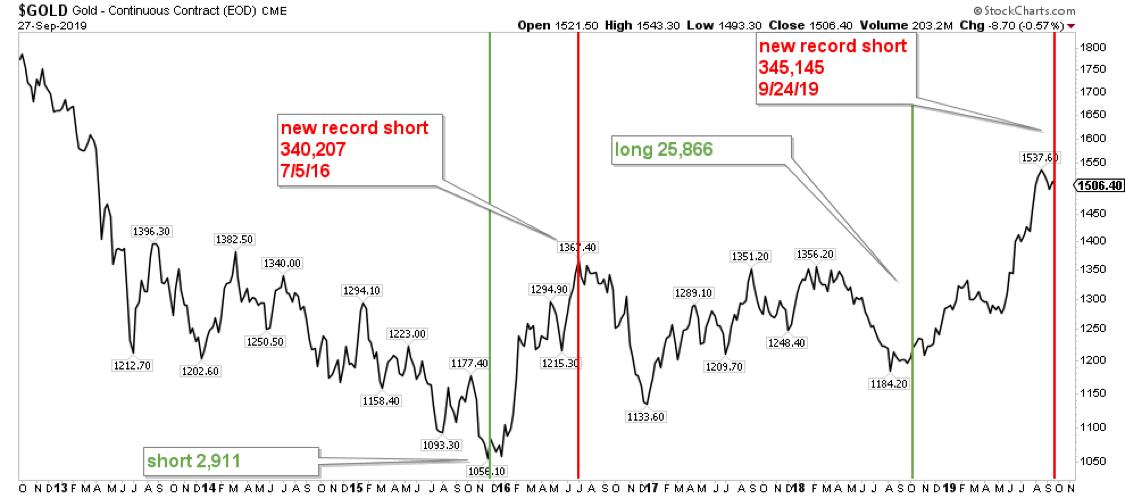
As you can see above, the commercials were almost back to being flat in December 2015, right as the gold price bottomed. As price moved higher, commercial shorts started to grow again, confirming that a rally had begun. The rally ran until July when, on July 5th, the commercial position hit a new record short position of 340,270 contracts. That marked the peak in price and a correction began.
In October 2018, the commercial position actually turned positive with a net long 25,866 contracts, something that had not been seen since 12/11/2001. That long position occurred close to the 2018 low, which marked the beginning of a run to the recent highs. This week, the commercials broke their prior record and are now net short 345,145 contracts. Will this confirm a correction has begun off the recent high? Time will tell.
After my article last week, in which I suggested that the gold trade was a crowded one based on the COT report, I had several people tell me that maybe it was different this time and the commercials would be wrong. Sure, it could be that the gold price moves higher and the commercial short position grows to another record. But, based on watching these reports for over 30 years, I would not bet against the smart money as I think that gold has now begun a correction. What should happen, if history is our guide, is that the gold price will come down and the commercial short position will shrink as they cover their shorts, while the large and small specs sell their long positions.
Why does that happen? Typically, large specs are CTAs, which are often technically-oriented trend followers, and trend followers usually overdo things at extremes. They will stay long until they get confirmation that the trend has changed and, when it does, they typically do a sell-and-reverse (SAR) where they flip from long to short (or vice versa when they’ve been short in a down trend). What that means to the futures market is that there are funds flipping from long to short, so if a CTA that is long 10,000 futures contracts gets their trend change signal, they will be selling their 10,000 long futures and then selling another 10,000 futures to flip to a short positon. This is often why you see a big bar move in the futures market. You might then read about “sloppy” selling or “manipulation,” but the reality is that technical traders (or algos) will simply take their signal and make the trade, pounding it out to get their position in place so as to catch the trend change.
I will continue to watch, and pay close attention to, what the smart money commercials do across the futures market. I pay little attention to newsletter writers, mainstream media articles and talking heads on TV, because I care more about what someone is doing with their money as opposed to just stating an opinion. The COT report is very important record of money bets being placed. Not unlike equity traders that watch short interest in a stock, the COT report can show how one-sided the bets have become.
Right now the “smart money” commercials are short 345,145 gold futures, which means that they are short 34.5 million ounces of gold as each contract equals 100 ounces of gold. At today’s price of roughly $1,500 an ounce, the notional value of their futures contract short is $51,771,750,000 – that’s a lot of money. Granted, these are commercial “hedgers” so I will assume that they have a lot of that covered with either gold in the ground, gold in a vault or some other “long” gold position somewhere else. So, not only do they have deep pockets, but they are also hedged and, at the same time, “know” their industry. What gives me pause is that the other side of that trade is large and small specs, speculators that are betting on price direction. The specs might have some hedges themselves in the options market, but they are still highly leveraged and holding a notional value of $51,771,750,000 worth of gold. If price turns lower, they will not hesitate to liquidate their longs. I would prefer to not be in their way when they start selling.
Tim Taschler, CMT
Sprott USA
Read Full Story »»»
 • DiscoverGold
By: Tim Taschler | September 30, 2019
* (Click Read Full Story »»» at the bottom of the page for the charts to appear on the post)
I got my start in the markets as a floor trader on the Chicago Board of Options Exchange (CBOE) and Chicago Board of Trade (CBOT) in 1986. Since those early days on the floor, I've paid close attention to the Commitment of Traders Report (COT) that comes out every Friday. Why? Because unlike newsletters and talking heads on TV, the COT report is about people putting down millions of dollars of real money on a position.
The COT tracks three groups. The first group, small specs, is comprised of people like you and me, who might trade a few futures contracts, while the second group, the large specs, are hedge funds and CTAs (Commodity Trading Advisor). The third group, often referred to as the “smart money,” is comprised of those who use the futures market to primarily hedge their business activities. Examples of commercials in wheat would include farmers, silo operators and bread makers, so we are looking at trades by the likes of Cargill, Archer Daniels Midland, Bunge, Kraft, Pillsbury and General Mills. As should be obvious, these commercial players know their industry, as they have been in business for decades and understand the market trends - supply and demand - that affect their business (hence the “smart money” designation).
The COT data is released every Friday at 3:30 pm ET and can be found on the CFTC website. You can chart the COT data on the CME website or at Barchart. Alternatively, you can simply download the CFTC data and build your own chart in Excel, like this one (data CTFC, 9/27/19):

You can also track the COT versus price on your StockCharts chart with some simple annotations, as my gold chart shows here (courtesy of StockCharts.com, 9/29/19):

As you can see above, the commercials were almost back to being flat in December 2015, right as the gold price bottomed. As price moved higher, commercial shorts started to grow again, confirming that a rally had begun. The rally ran until July when, on July 5th, the commercial position hit a new record short position of 340,270 contracts. That marked the peak in price and a correction began.
In October 2018, the commercial position actually turned positive with a net long 25,866 contracts, something that had not been seen since 12/11/2001. That long position occurred close to the 2018 low, which marked the beginning of a run to the recent highs. This week, the commercials broke their prior record and are now net short 345,145 contracts. Will this confirm a correction has begun off the recent high? Time will tell.
After my article last week, in which I suggested that the gold trade was a crowded one based on the COT report, I had several people tell me that maybe it was different this time and the commercials would be wrong. Sure, it could be that the gold price moves higher and the commercial short position grows to another record. But, based on watching these reports for over 30 years, I would not bet against the smart money as I think that gold has now begun a correction. What should happen, if history is our guide, is that the gold price will come down and the commercial short position will shrink as they cover their shorts, while the large and small specs sell their long positions.
Why does that happen? Typically, large specs are CTAs, which are often technically-oriented trend followers, and trend followers usually overdo things at extremes. They will stay long until they get confirmation that the trend has changed and, when it does, they typically do a sell-and-reverse (SAR) where they flip from long to short (or vice versa when they’ve been short in a down trend). What that means to the futures market is that there are funds flipping from long to short, so if a CTA that is long 10,000 futures contracts gets their trend change signal, they will be selling their 10,000 long futures and then selling another 10,000 futures to flip to a short positon. This is often why you see a big bar move in the futures market. You might then read about “sloppy” selling or “manipulation,” but the reality is that technical traders (or algos) will simply take their signal and make the trade, pounding it out to get their position in place so as to catch the trend change.
I will continue to watch, and pay close attention to, what the smart money commercials do across the futures market. I pay little attention to newsletter writers, mainstream media articles and talking heads on TV, because I care more about what someone is doing with their money as opposed to just stating an opinion. The COT report is very important record of money bets being placed. Not unlike equity traders that watch short interest in a stock, the COT report can show how one-sided the bets have become.
Right now the “smart money” commercials are short 345,145 gold futures, which means that they are short 34.5 million ounces of gold as each contract equals 100 ounces of gold. At today’s price of roughly $1,500 an ounce, the notional value of their futures contract short is $51,771,750,000 – that’s a lot of money. Granted, these are commercial “hedgers” so I will assume that they have a lot of that covered with either gold in the ground, gold in a vault or some other “long” gold position somewhere else. So, not only do they have deep pockets, but they are also hedged and, at the same time, “know” their industry. What gives me pause is that the other side of that trade is large and small specs, speculators that are betting on price direction. The specs might have some hedges themselves in the options market, but they are still highly leveraged and holding a notional value of $51,771,750,000 worth of gold. If price turns lower, they will not hesitate to liquidate their longs. I would prefer to not be in their way when they start selling.
Tim Taschler, CMT
Sprott USA
Read Full Story »»»
 • DiscoverGold
Information posted to this board is not meant to suggest any specific action, but to point out the technical signs that can help our readers make their own specific decisions. Your Due Dilegence is a must!
• DiscoverGold
Join the InvestorsHub Community
Register for free to join our community of investors and share your ideas. You will also get access to streaming quotes, interactive charts, trades, portfolio, live options flow and more tools.

