The MSCI All-World Stock Index is Testing its Early 2018 High By: John Murphy | July 26, 2019
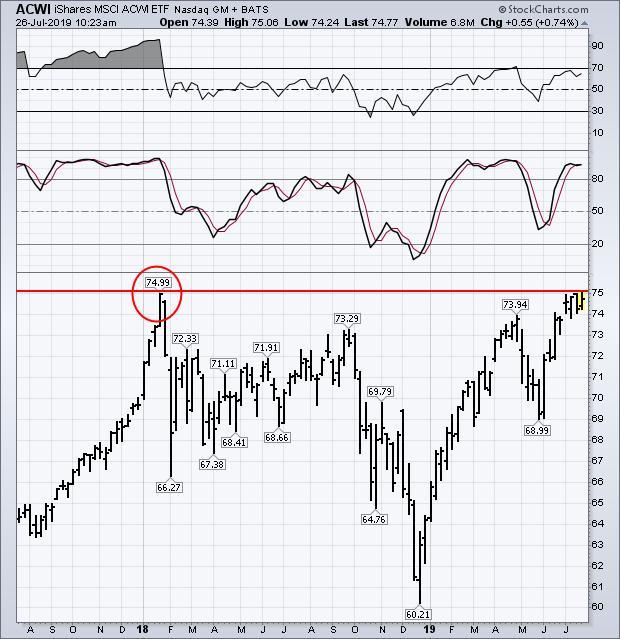
Global stock indexes are once again testing overhead resistance barriers. The weekly bars in Chart 1 show the MSCI All Country World Index iShares (ACWI) in the process of testing its previous high set at the start of 2018 (see red circle). Any test of a prominent previous peak always bears close watching. Weekly momentum indicators also suggest a potential overbought condition.
The 9-week RSI line (top box) is nearing overbought territory at 70. While the 14-week slow stochastics oscillator (middle box) is already well into overbought territory over 80. That doesn't mean that the ACWI won't clear its 2018 peak. It just means that global stocks have another chart barrier to overcome. More than half of the ACWI (56%) is comprised of U.S stocks (which have already hit new highs). Foreign stocks (which are lagging way behind the U.S.) are holding it back.
Information posted to this board is not meant to suggest any specific action, but to point out the technical signs that can help our readers make their own specific decisions. Your Due Dilegence is a must! • DiscoverGold
Register for free to join our community of investors and share your ideas. You will also get access to streaming quotes, interactive charts, trades, portfolio, live options flow and more tools.


 News
News  Market Data
  Discover