


| Followers | 679 |
| Posts | 140715 |
| Boards Moderated | 37 |
| Alias Born | 03/10/2004 |
Monday, May 20, 2019 9:27:56 AM
Lower Highs, Lower Lows
By: Greg Schnell | May 19, 2019
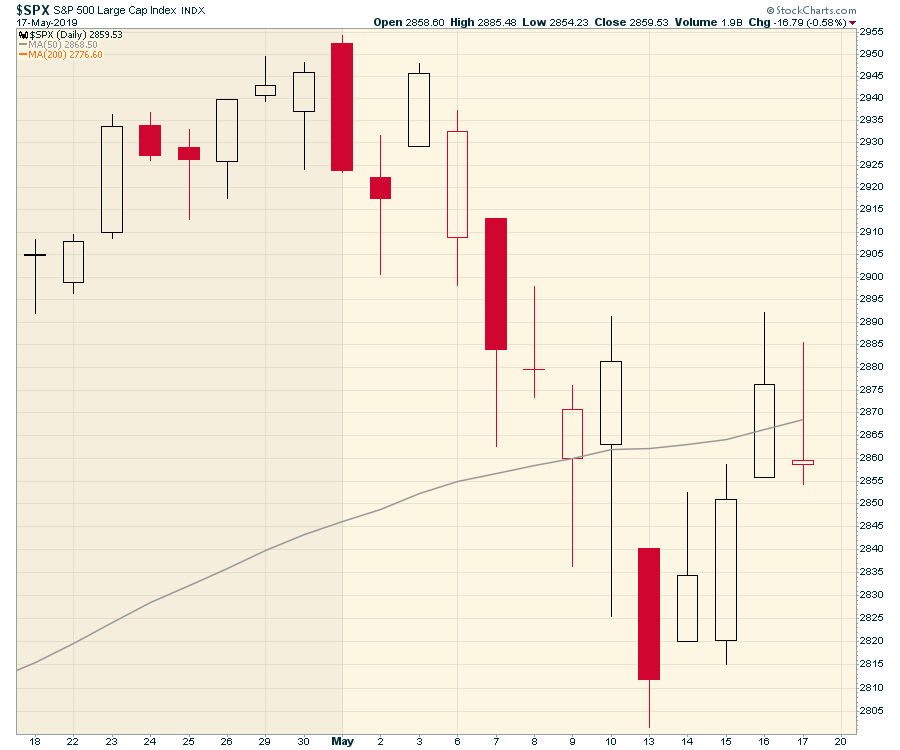
After opening with a sharply down Monday, the market spent the rest of last week trying to make up lost ground. On Friday, the morning started off weak, rallied through the morning and then fell, finishing near the day's lows into the close. Friday's reversing price action is not an optimistic finish for the week, as the market clearly lost some of its enthusiasm. We ultimately closed below the 50-day moving average on the week.
Looking at the bigger picture, we can see that breadth is still constrained. Strong breadth can be seen when all sectors are rallying, with lots of stocks participating. Declining breadth happens when fewer stocks participate as the market goes higher.
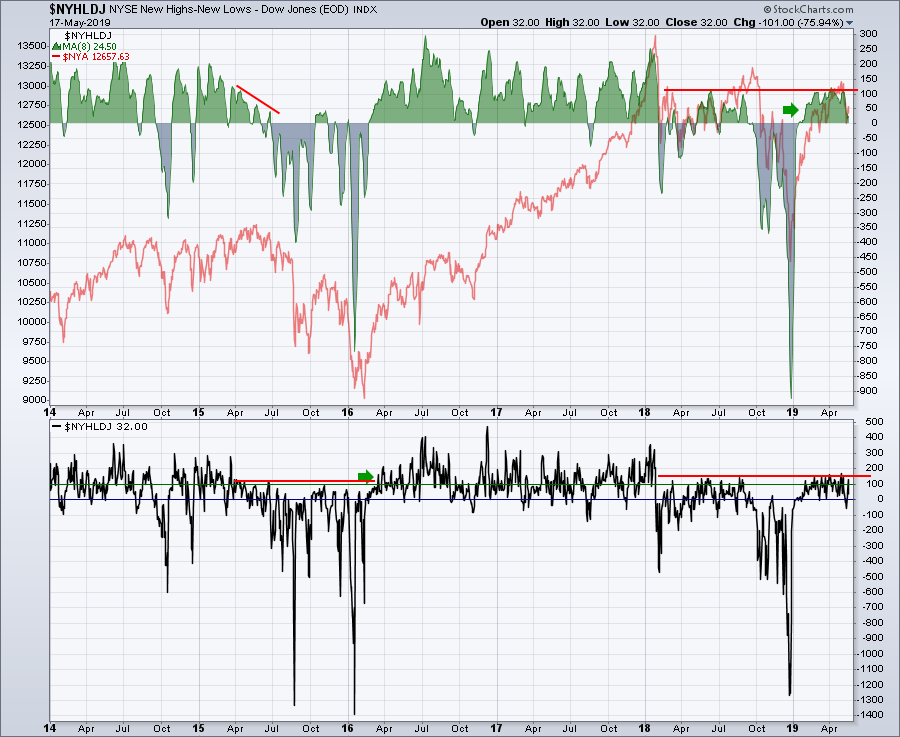
One way to measure breadth is the number of stocks making new highs compared to new lows. This is a simple daily calculation, adding up all the stocks hitting new highs minus all the stocks hitting new lows and plotting the number in the bottom panel. In the top panel, we have an 8-day moving average of the Net New Highs shown as an area chart. The red line is the New York Composite.
Throughout the rally off the December lows, the number of stocks making new highs has been constrained. This is shown by the similarity to 2015 and the 2nd quarter of 2018 across the net new highs indicator. In 2016, within a few months of the low, the net number of stocks making new highs vs. new lows surged above 150, shown by the green arrow. This surge showed increasing breadth, with lots of stocks making new highs on any given day. In 2018, while the $SPX went to new highs in September, the breadth shown on this chart never really got going and, by the September market top, the net new highs were below zero. This week, the market starting making more new lows than new highs (dipping below zero) for the first time since the rally started.
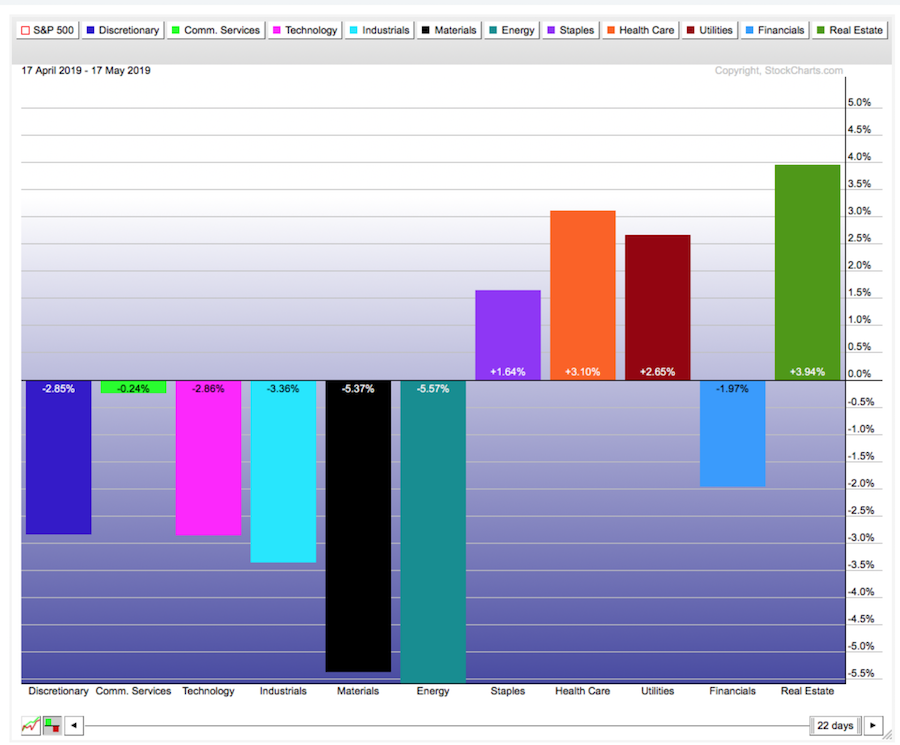
The rotation into defensive sectors has been going on for four weeks already. Even after the big earnings from Microsoft, Apple and the massive buyback as well as Amazon and Berkshire Hathaway sharing some love, the defensives have been leading.
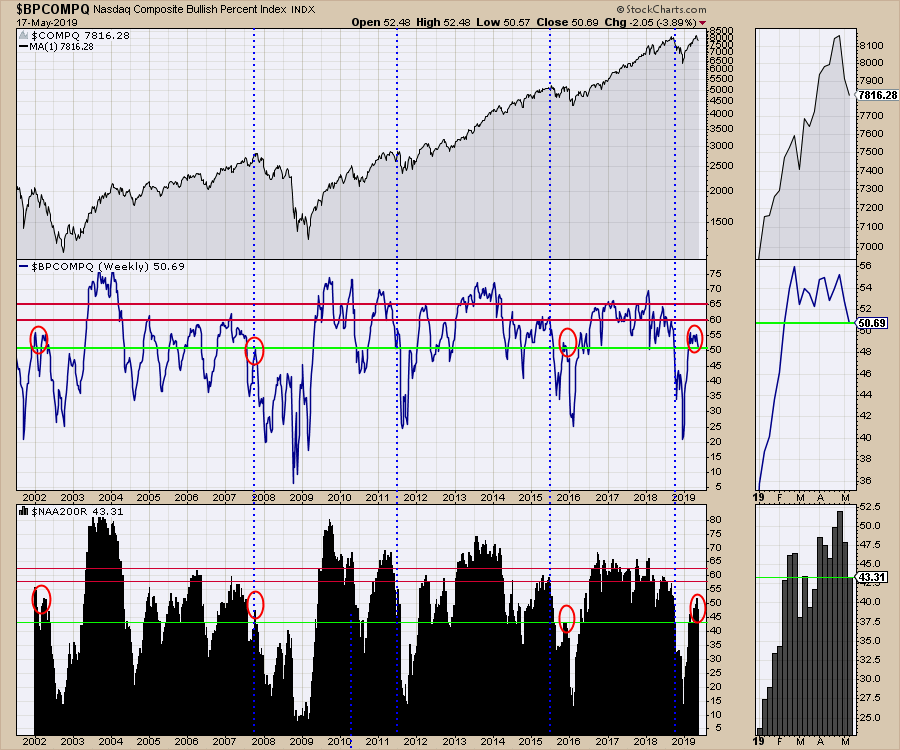
Another breadth indicator, the Bullish Percent Index, has plummeted in recent weeks over the tariff reaction. I've mentioned a few times that the indicator stalled at similar levels to 2002 and 2007 on different indexes. Currently, only 50% of the stocks are on a buy signal. The index closed the week at the lowest levels we saw in 2018 while the market was moving higher.
Another method for breadth is calculating what percentage of stocks are above a long-term moving average. This is shown in the lower panel, where we are using the 200-day moving average. Compare the percentage of stocks above the 200-DMA in 2018 to now. That's a stunning shift lower. We are well below the lows of the broad market surge from 2016 to 2018; only 43% are above the long term average, shown in the bottom panel.
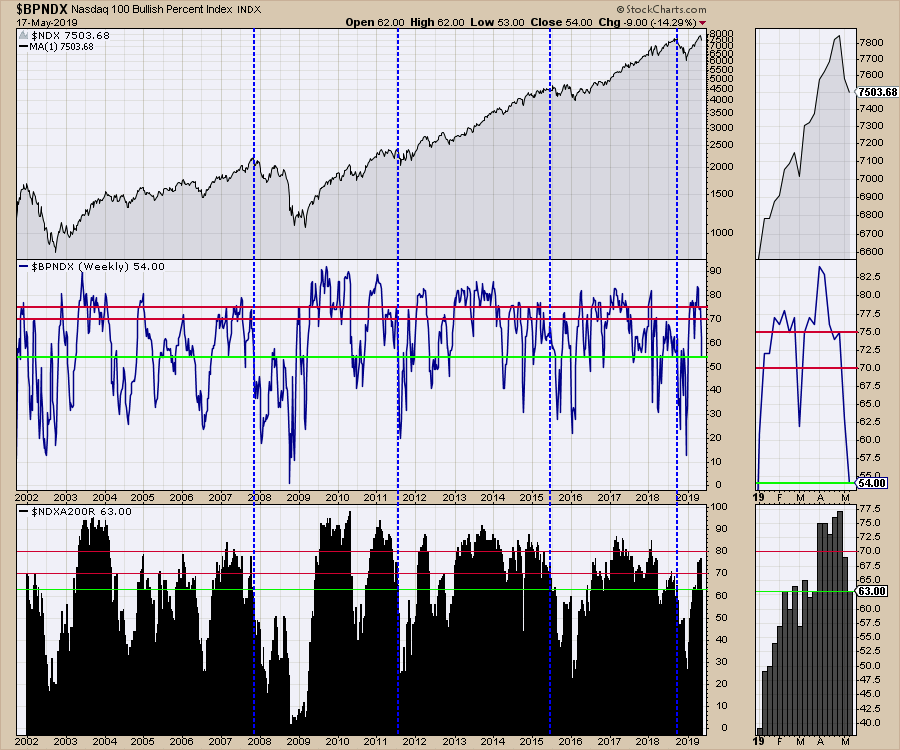
As always, the move to the safety of large caps is important. Perhaps staying invested in the large caps can help us through some of the volatility? Well, the large caps have been dropping to sell signals on the Bullish Percent Indexes. Below is the Nasdaq 100 Bullish Percent Index, which has dropped from 84% to 54%. So barely half of the stocks are on a buy signal and they are well below the safe zone between the two red lines. In the bottom panel, the percentage of stocks above the long-term average has slipped to 63%. When this indicator drops below 60% for the Nasdaq 100, we usually see market breakdowns. 14 stocks fell below the 200-day moving average within the last two weeks, as shown in the zoom panel. Knowing the breadth on the broader Nasdaq market above suggests this narrow index of 100 stocks has little support if we see any further weakness.
When we get sudden shocks in a big bull market, the breadth is wide enough to hold up. In this case, the breadth was okay for the large cap indexes, but not for the broad market of stocks. Now, the large caps are already in question. Below is the broader S&P 500 using the same indicators; both are hovering at 60%. Because the broader markets are not soaring, the underpinnings for this market are weaker.
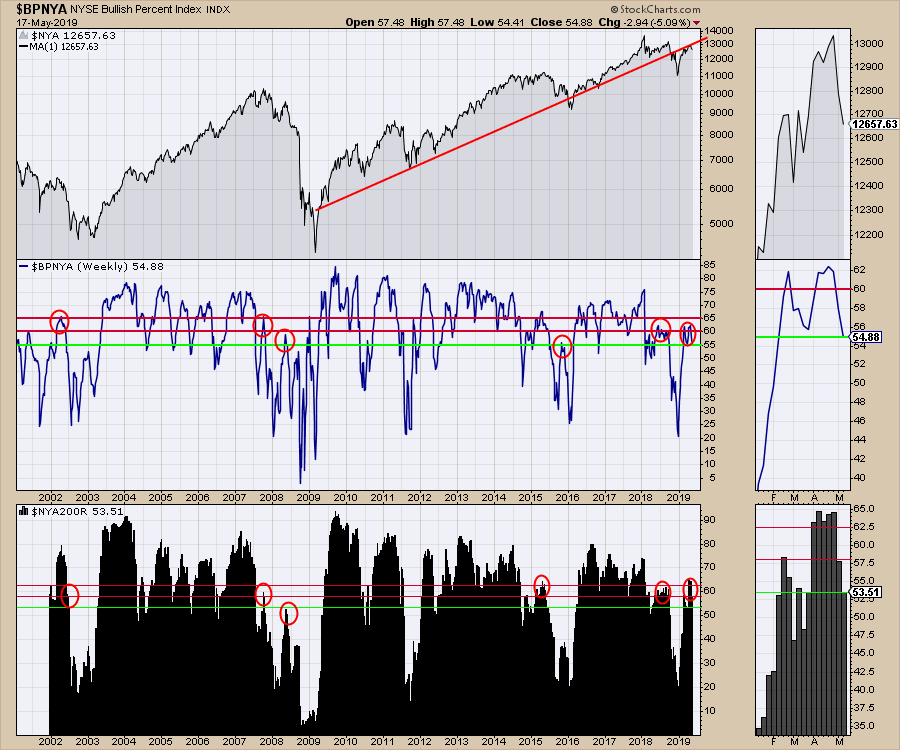
I like to watch the Nasdaq Composite ($COMPQ) and the New York Composite ($NYA) for weakness. We covered $COMPQ earlier in the article, so let's look at $NYA now.
This market typically weakens before the $SPX breaks down. This week, the stage is set for more weakness. With just more than 1/2 the stocks bullish, it would not take much to start another down move; we'll need some strong forces to push the indexes back up.
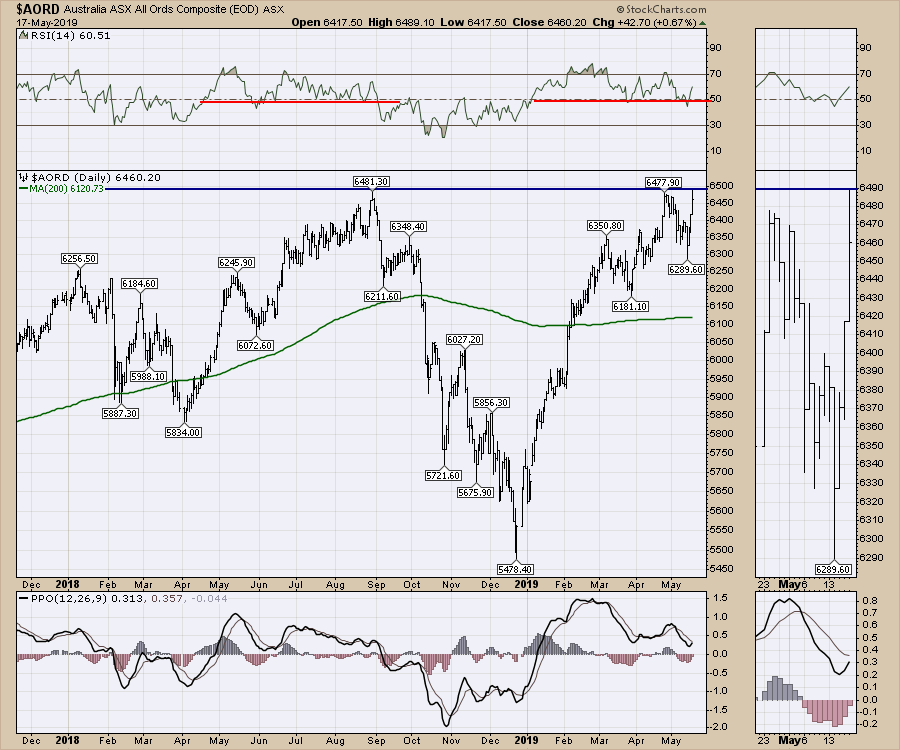
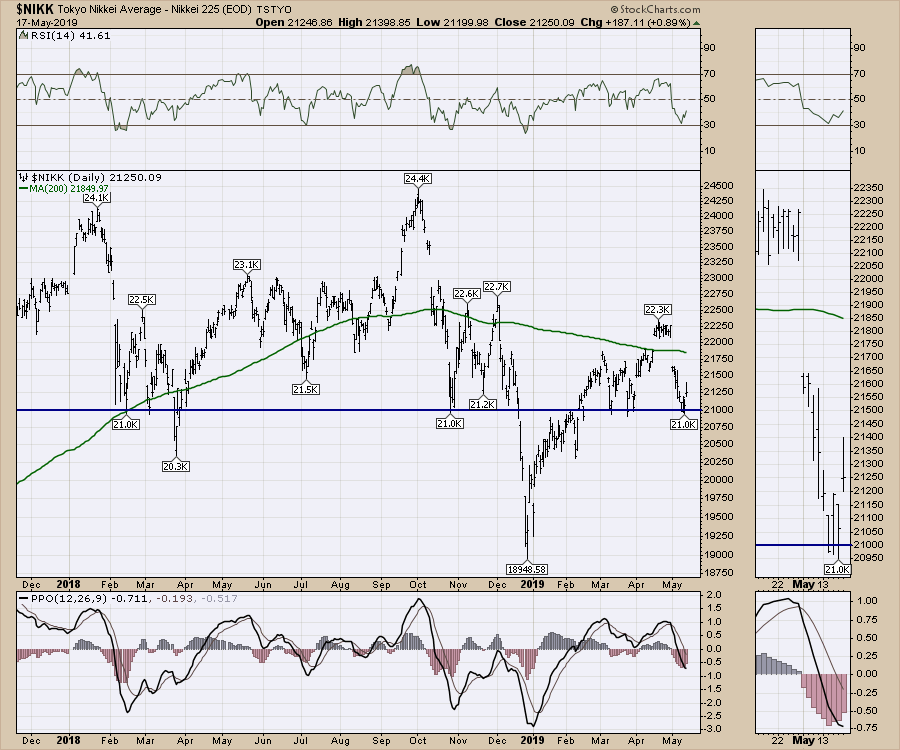
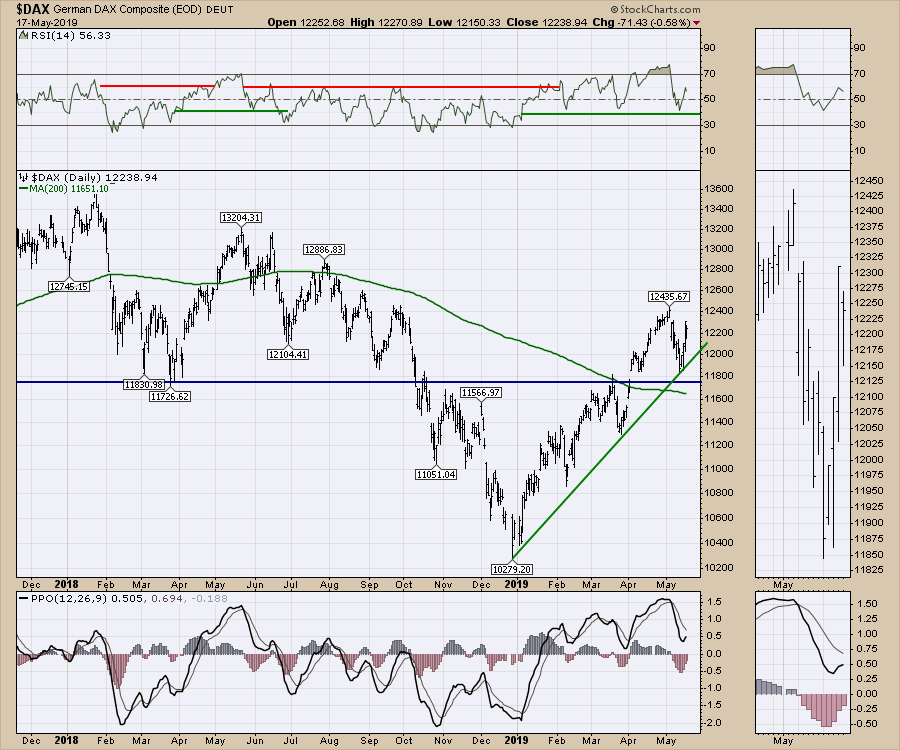
My outlook for the week is heavily reliant on watching the rest of world markets. Australia made new highs last week, which is bullish. Japan and Germany continue to hover near minimum support levels of 21000 and 11750, respectively.
Japan is just above support, but momentum, shown using the PPO, is already below zero. Note the down-sloping 200-day moving average.
Germany had some wild swings this week but closed near the highs of the week. Note the down-sloping 200-DMA.
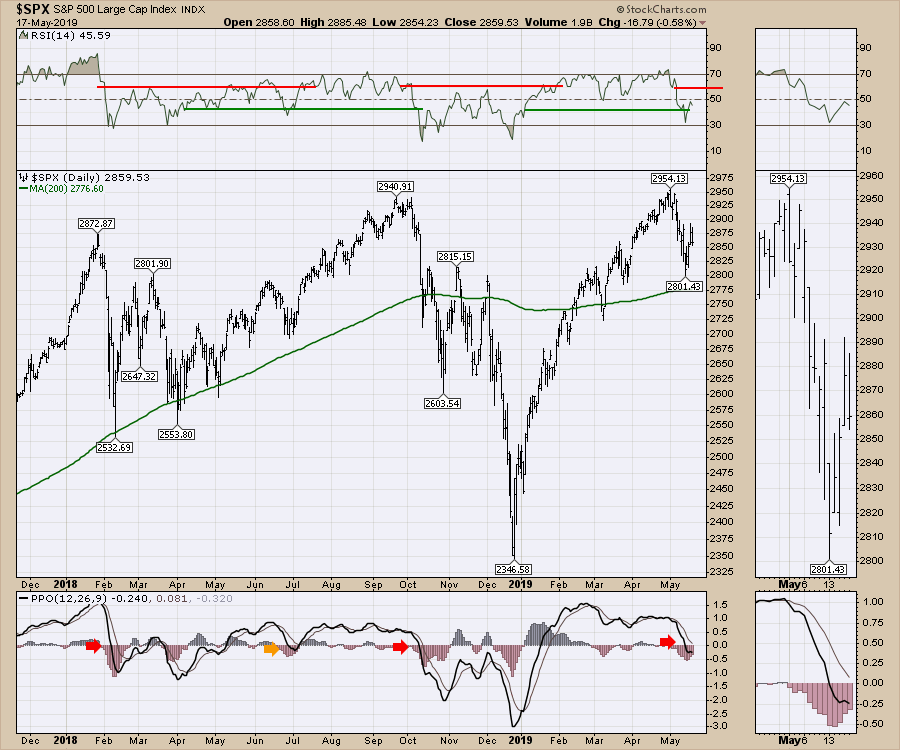
Will the $SPX momentum drop below zero? The RSI is signaling enough weakness to start a downtrend. The PPO is at zero. Will it bounce or fail? Note the up-sloping 200-DMA.
Thanks for following along! Make sure to stay focused on price action. As I have pointed out in recent weeks, there is the potential that this is the right shoulder of a major top, which usually implies a sudden move down. With the defensive sectors leading, the breadth waning and the global trade flows being impacted, there are plenty of reasons to expect lower prices, so keep an eye out to see if it follows through.
Good trading,
Greg Schnell, CMT, MFTA
Read Full Story »»»
• DiscoverGold
By: Greg Schnell | May 19, 2019
After opening with a sharply down Monday, the market spent the rest of last week trying to make up lost ground. On Friday, the morning started off weak, rallied through the morning and then fell, finishing near the day's lows into the close. Friday's reversing price action is not an optimistic finish for the week, as the market clearly lost some of its enthusiasm. We ultimately closed below the 50-day moving average on the week.

Looking at the bigger picture, we can see that breadth is still constrained. Strong breadth can be seen when all sectors are rallying, with lots of stocks participating. Declining breadth happens when fewer stocks participate as the market goes higher.
One way to measure breadth is the number of stocks making new highs compared to new lows. This is a simple daily calculation, adding up all the stocks hitting new highs minus all the stocks hitting new lows and plotting the number in the bottom panel. In the top panel, we have an 8-day moving average of the Net New Highs shown as an area chart. The red line is the New York Composite.
Throughout the rally off the December lows, the number of stocks making new highs has been constrained. This is shown by the similarity to 2015 and the 2nd quarter of 2018 across the net new highs indicator. In 2016, within a few months of the low, the net number of stocks making new highs vs. new lows surged above 150, shown by the green arrow. This surge showed increasing breadth, with lots of stocks making new highs on any given day. In 2018, while the $SPX went to new highs in September, the breadth shown on this chart never really got going and, by the September market top, the net new highs were below zero. This week, the market starting making more new lows than new highs (dipping below zero) for the first time since the rally started.

The rotation into defensive sectors has been going on for four weeks already. Even after the big earnings from Microsoft, Apple and the massive buyback as well as Amazon and Berkshire Hathaway sharing some love, the defensives have been leading.

Another breadth indicator, the Bullish Percent Index, has plummeted in recent weeks over the tariff reaction. I've mentioned a few times that the indicator stalled at similar levels to 2002 and 2007 on different indexes. Currently, only 50% of the stocks are on a buy signal. The index closed the week at the lowest levels we saw in 2018 while the market was moving higher.
Another method for breadth is calculating what percentage of stocks are above a long-term moving average. This is shown in the lower panel, where we are using the 200-day moving average. Compare the percentage of stocks above the 200-DMA in 2018 to now. That's a stunning shift lower. We are well below the lows of the broad market surge from 2016 to 2018; only 43% are above the long term average, shown in the bottom panel.

As always, the move to the safety of large caps is important. Perhaps staying invested in the large caps can help us through some of the volatility? Well, the large caps have been dropping to sell signals on the Bullish Percent Indexes. Below is the Nasdaq 100 Bullish Percent Index, which has dropped from 84% to 54%. So barely half of the stocks are on a buy signal and they are well below the safe zone between the two red lines. In the bottom panel, the percentage of stocks above the long-term average has slipped to 63%. When this indicator drops below 60% for the Nasdaq 100, we usually see market breakdowns. 14 stocks fell below the 200-day moving average within the last two weeks, as shown in the zoom panel. Knowing the breadth on the broader Nasdaq market above suggests this narrow index of 100 stocks has little support if we see any further weakness.

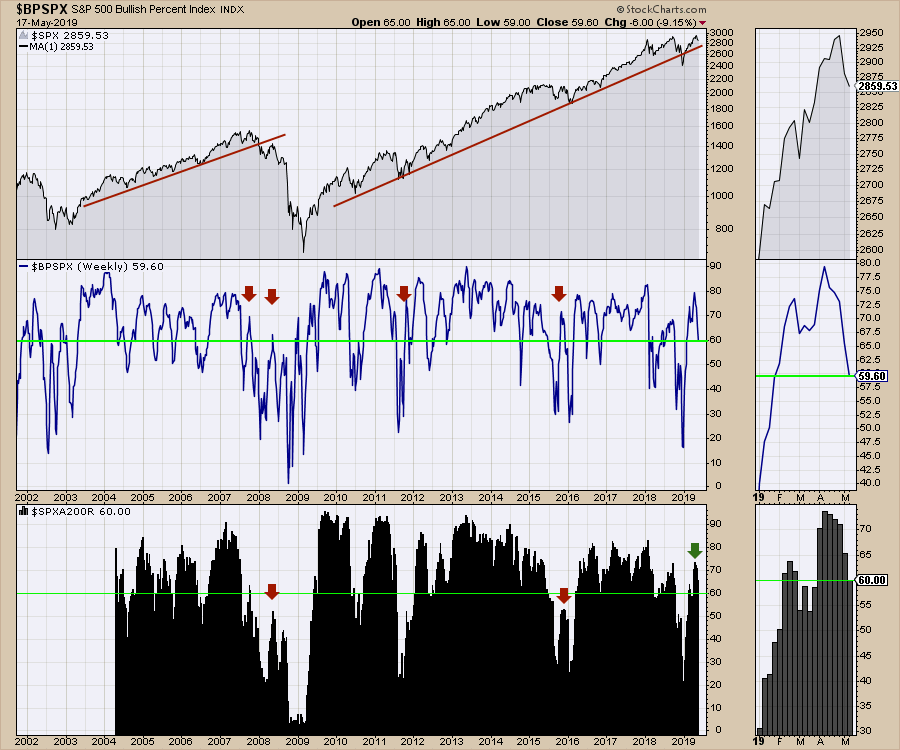
When we get sudden shocks in a big bull market, the breadth is wide enough to hold up. In this case, the breadth was okay for the large cap indexes, but not for the broad market of stocks. Now, the large caps are already in question. Below is the broader S&P 500 using the same indicators; both are hovering at 60%. Because the broader markets are not soaring, the underpinnings for this market are weaker.

I like to watch the Nasdaq Composite ($COMPQ) and the New York Composite ($NYA) for weakness. We covered $COMPQ earlier in the article, so let's look at $NYA now.
This market typically weakens before the $SPX breaks down. This week, the stage is set for more weakness. With just more than 1/2 the stocks bullish, it would not take much to start another down move; we'll need some strong forces to push the indexes back up.

My outlook for the week is heavily reliant on watching the rest of world markets. Australia made new highs last week, which is bullish. Japan and Germany continue to hover near minimum support levels of 21000 and 11750, respectively.

Japan is just above support, but momentum, shown using the PPO, is already below zero. Note the down-sloping 200-day moving average.

Germany had some wild swings this week but closed near the highs of the week. Note the down-sloping 200-DMA.


Will the $SPX momentum drop below zero? The RSI is signaling enough weakness to start a downtrend. The PPO is at zero. Will it bounce or fail? Note the up-sloping 200-DMA.
Thanks for following along! Make sure to stay focused on price action. As I have pointed out in recent weeks, there is the potential that this is the right shoulder of a major top, which usually implies a sudden move down. With the defensive sectors leading, the breadth waning and the global trade flows being impacted, there are plenty of reasons to expect lower prices, so keep an eye out to see if it follows through.
Good trading,
Greg Schnell, CMT, MFTA
Read Full Story »»»
• DiscoverGold
Information posted to this board is not meant to suggest any specific action, but to point out the technical signs that can help our readers make their own specific decisions. Your Due Dilegence is a must!
• DiscoverGold
Join the InvestorsHub Community
Register for free to join our community of investors and share your ideas. You will also get access to streaming quotes, interactive charts, trades, portfolio, live options flow and more tools.

