CoT: Peek Into Future Through Futures, How Hedge Funds Are Positioned By: Hedgopia | May 18, 2019
Following futures positions of non-commercials are as of May 14, 2019.
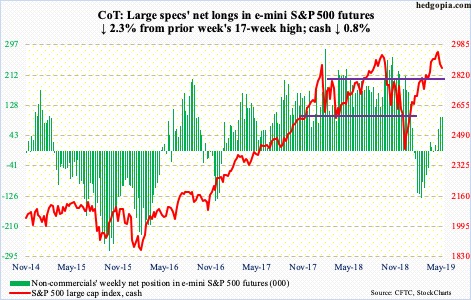
E-mini S&P 500:Currently net long 93.9k, down 2.2k.
Another $12.3 billion left US-based equity funds (courtesy of Lipper). In the same week, SPY (SPDR S&P 500 ETF), VOO (Vanguard S&P 500 ETF) and IVV (iShares core S&P 500 ETF) lost a combined $6 billion (courtesy of ETF.com), even as money-market funds rose $16.6 billion to $3.1 trillion (courtesy of ICI).
The week offered a little something for both bulls and bears. The cash (2859.53) opened with a 2.8-percent intraday drop Monday but found support at just north of 2800. For 14 months now, this price point has provided support and resistance. The most recent breakout took place mid-March. This week’s action was a successful retest. However, before bulls could think of testing the all-time high of 2954.13 from May 1, they would first need to reclaim 2890s, which bears defended both Thursday and Friday. The weekly has plenty of room to continue unwinding its overbought condition. Traders have not really taken to risk-on.
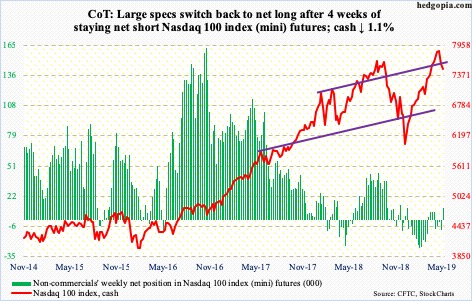
Nasdaq 100 index (mini):Currently net long 11.5k, up 20.8k.
The cash (7503.68) opened the week with a loss of the 50-day, dropping to 7303.64 intraday Monday. At least until Wednesday, flows were not in cooperation, as QQQ (Invesco QQQ trust) lost $187 million in the week ended that session (courtesy of ETF.com).
Despite this, from down 3.7 percent intraday Monday to down 1.1 percent for the week, bulls did salvage the damage. They would love to go and test 7700 again, but this is proving tough right at this minute. Weekly momentum indicators continue lower. After an extended run – up in 18 out of 19 weeks – this was the second consecutive down week.
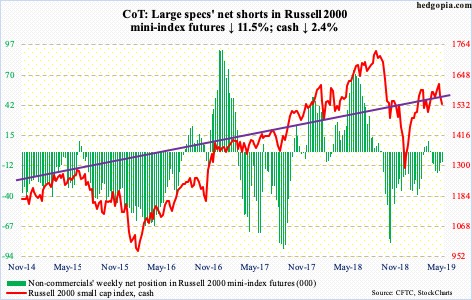
Russell 2000 mini-index:Currently net short 8.4k, down 1.1k.
Several times going back to January last year, bulls and bears locked horns just north of 1600. The rally from last December stopped on February 25 at 1602.10. Later, on April 29, it again retreated from 1603.08. So, on the 6th this month when the cash (1535.76) closed at 1614.98, hopes were high that a breakout would result in a jump in risk-on sentiment. Things did not quite pan out that way.
Monday, the Russell 2000 sliced right through the 50- and 200-day, which have converged. The index already lost a trend line from last December. As things stand, even if the daily continues to unwind its oversold condition, a test of that resistance is looking difficult.
In the week through Wednesday, IJR (iShares core S&P small-cap ETF) gained $85 million, but IWM (iShares Russell 2000 ETF) lost $364 million. For the latter, this was the fifth straight week of outflows, having lost $1.5 billion in the prior four (courtesy of ETF.com).
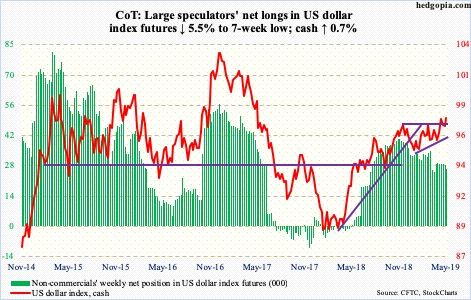
US Dollar Index:Currently net long 26.7k, down 1.6k.
After defending the 50-day on Monday, dollar bulls once again hammered on – and succeeded in clearing – resistance at 97.50s. This level repelled breakout attempts for six months now. Last September, the US dollar index (97.82) dropped to 93.39 before making higher lows. The resulting ascending triangle can be a continuation pattern. For now, the daily has room to continue higher. Three weeks ago, the index retreated after posting 98.09, which has now gained in significance.
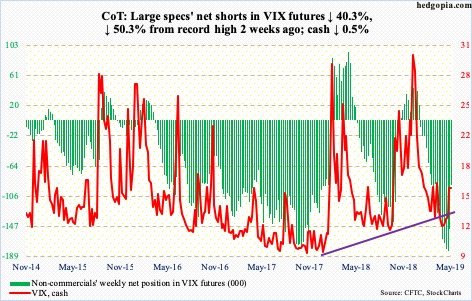
VIX:Currently net short 89.7k, down 60.6k.
After last week’s spike reversal, premium came out fast this week. The cash (15.96) tried to rally Monday but could not keep up the momentum. By Wednesday, the 200-day was lost. The 50-day rests at 14.37. For a couple of months now, volatility bulls have consistently defended 12, a test of which is their worse-case scenario near term. This probably does not come to pass near term.
Non-commercials have begun unwinding their record net shorts in VIX futures. In a couple of weeks, holdings have been cut in half. Unwinding can continue. In the meantime, the cash just formed a potentially bullish weekly MACD crossover.
Click on "In reply to", for Authors past commentaries
Information posted to this board is not meant to suggest any specific action, but to point out the technical signs that can help our readers make their own specific decisions. Your Due Dilegence is a must! • DiscoverGold
Register for free to join our community of investors and share your ideas. You will also get access to streaming quotes, interactive charts, trades, portfolio, live options flow and more tools.


 News
News  Market Data
  Discover