Stock-Market Margin Debt, after Plunging in Q4, Has Not Bounced Back Despite S&P 500 Historic Surge By: Wolf Richter | April 23, 2019
Leery investors?
During the ugliest October in the stock market that anyone could remember, a nasty November, and a brutal pre-Christmas December, margin debt plunged by $94 billion, the deepest three-month plunge since Q4 2008, after Lehman Brothers filed for bankruptcy. That’s how it usually happens, whether out of fear or forced selling via margin calls: When the stock market plunges, margin debt plunges with it, either resulting from the stock market plunge or adding force to the stock market plunge. But since December 24, stocks, junk bonds, leveraged loans, long-dated government and corporate bonds, and many other assets have skyrocketed. So, has margin debt surged with it?
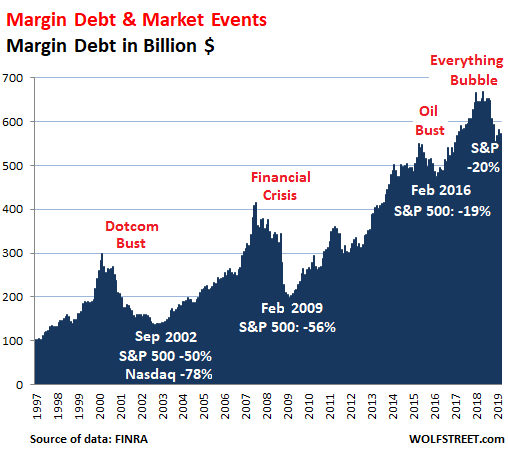
Nope. In March, margin debt ticked down $7.2 billion from February, to $574 billion, according to FINRA, the non-governmental organization that regulates member brokerage firms and exchange markets. This follows two upticks in January and February. Margin debt is down $71 billion, or 11%, from March 2018, and down 14% from the peak of $669 billion in May 2018. But the moves of the three months combined are small compared to the prior plunges:
With a long-term chart like this, the dollar amounts are less relevant since the purchasing power of the dollar has dropped over the period. What is important are the movements, and how they relate to stock market events (indicated in white).
Over the longer term, there is a tight relationship between stock market surges and sell-offs and margin debt. Stock-market moves and margin debt feed off each other on the way up and on the way down, and there can be a lag between the two, with one coming before the other. Margin debt is not a predictor of the direction of the stock market, though high margin debt levels indicate that when stocks do fall, they tend to fall sharply.
There are many forms of stock market leverage, but “margin debt” – the amount individuals and institutions borrow from their brokers against their portfolios – is the only form that is actually reported on a monthly basis.
Other forms of stock market leverage include “securities-based loans” (SBL) that brokers extend to their clients (some brokers report the balances in their annual reports but they don’t have to), loans at the institutional level such as with hedge funds, loans by companies to their executives to buy the company’s shares, etc. So overall stock market leverage is far larger than margin debt, but no one really knows how large.
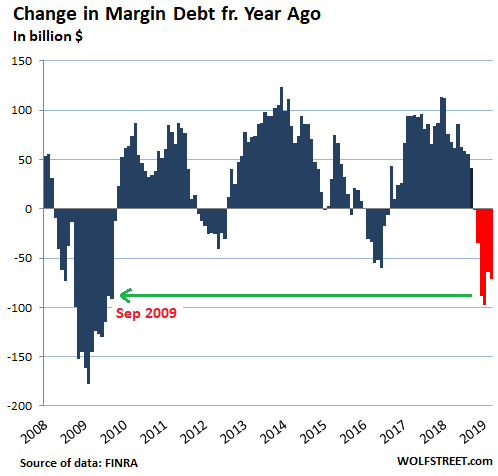
But reported margin debt gives us a feel for which direction overall stock-market leverage is going. The chart below shows just how steep the year-over-year plunges have been, the steepest since the Financial Crisis:
Stock market leverage is an accelerator when stocks go up as investors borrow money to buy stocks. And it’s an accelerator on the way down when margin calls and the fear of margin calls turn investors into forced or motivated sellers.
Despite the wind-down of margin debt in Q4, stock market leverage remains high – at about the same level as on the way up in March 2017. And for now, even as the S&P 500 is closing in on its September 2018 high, investors – perhaps still leery – have not jumped with both feet back into leveraging up their stock portfolios to the max.
Information posted to this board is not meant to suggest any specific action, but to point out the technical signs that can help our readers make their own specific decisions. Your Due Dilegence is a must! • DiscoverGold
Register for free to join our community of investors and share your ideas. You will also get access to streaming quotes, interactive charts, trades, portfolio, live options flow and more tools.


 News
News  Market Data
  Discover