DP (SPY) Weekly/Monthly Wrap: Unanimously Not Bullish By: Carl Swenlin | December 28, 2018
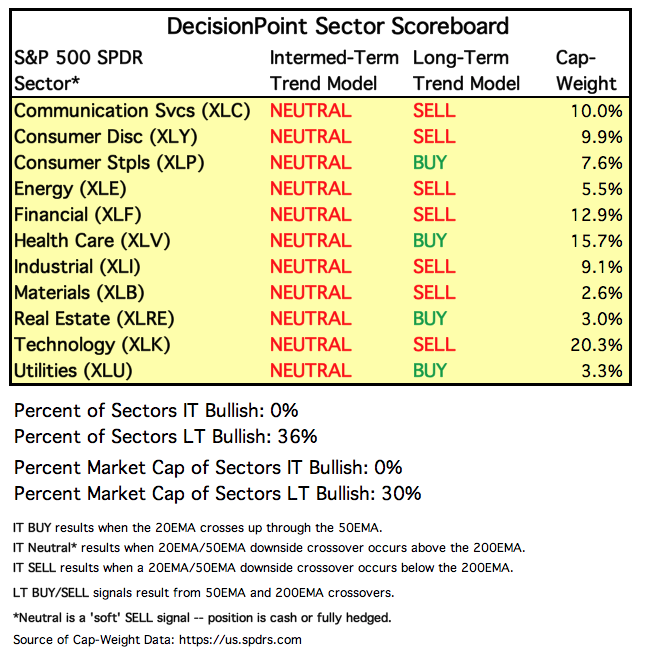
On Friday the signal for the Utilities sector changed from BUY to NEUTRAL, making it the last of the 11 S&P 500 sectors to lose its bullish stance. NEUTRAL sounds kind of, well, neutral, but it is really a 'soft' SELL signal because the position changes from long to cash or fully hedged. Seven of those 11 sectors now have Long-Term Trend Model SELL signals (50EMA is below the 200EMA).
MONTHLY CHART EXCEPTION: There is only one trading day left in the month, so I decided to include the monthly charts in this issue. If Monday's market action significantly changes any of the monthly outlooks, Erin will cover it.
STOCKS
IT Trend Model: NEUTRAL as of 10/15/2018
LT Trend Model: SELL as of 12/14/2018
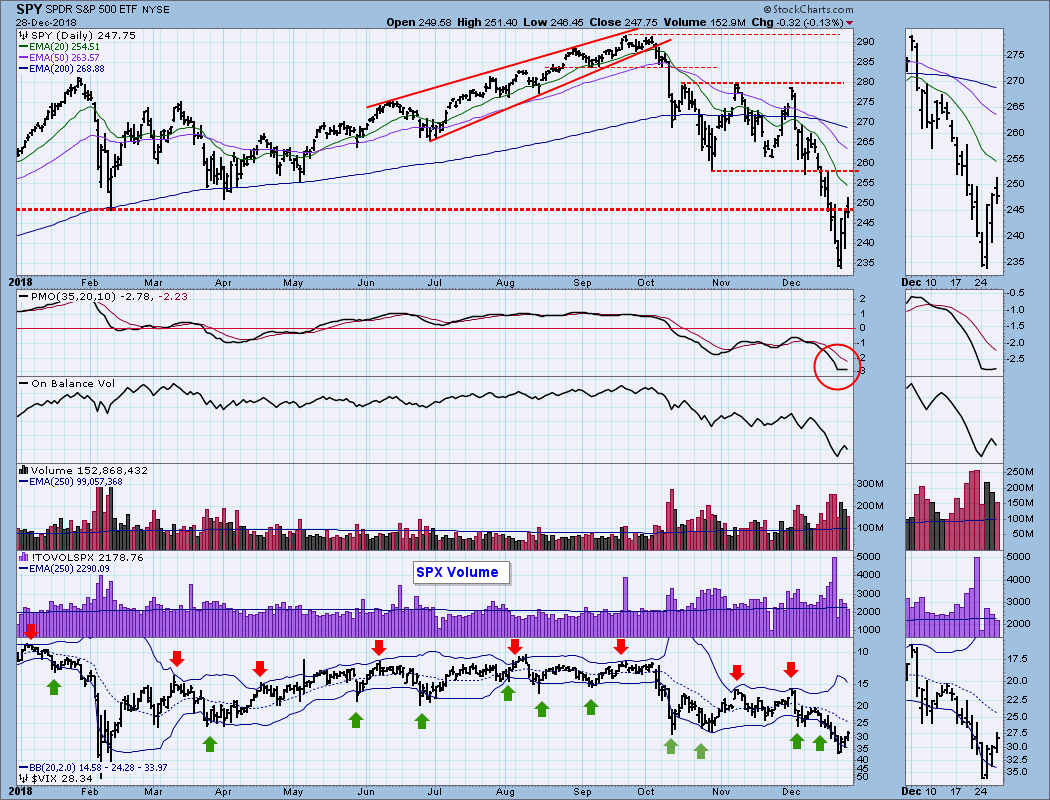
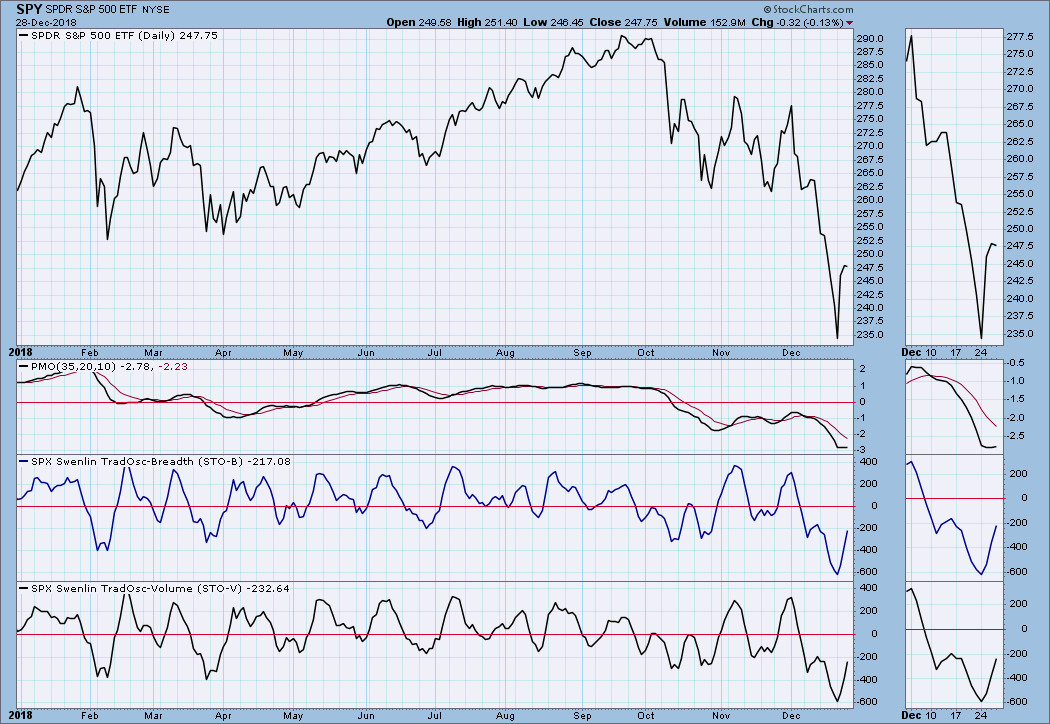
SPY Daily Chart: This week's advance was basically a short-covering rally. Things were really black on Monday, probably sucking in the last of the shorts. While Wednesday's huge rally caught our attention, volume on that day wasn't as exciting. Yes, it was above the 250EMA of volume, it should have been a lot higher if the move truly was a turning point. The daily PMO has turned up, but just barely.
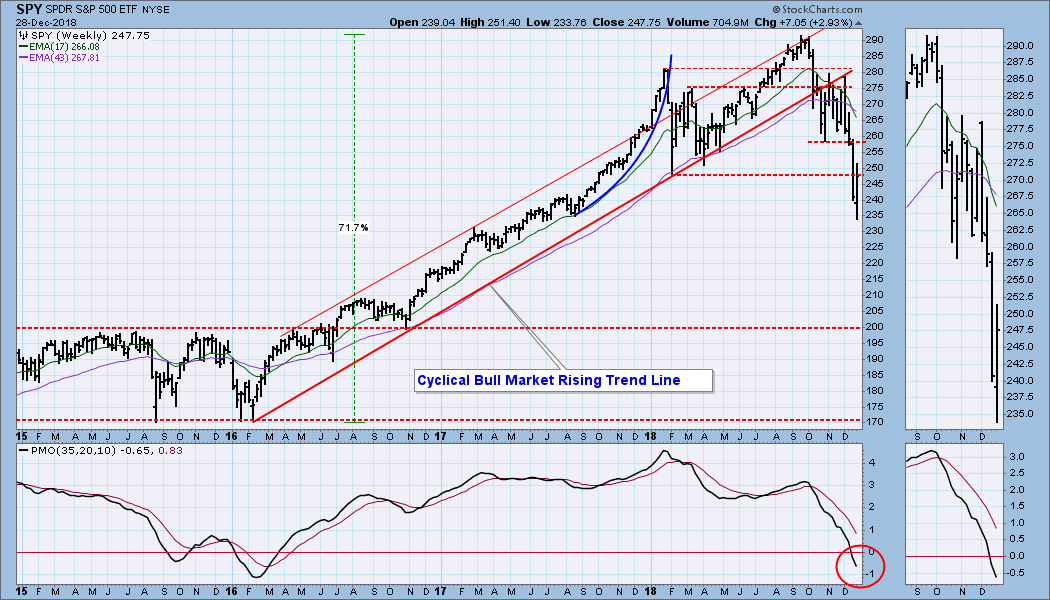
SPY Weekly Chart: The net gain for the week was just under +3%, and the weekly PMO was barely affected.
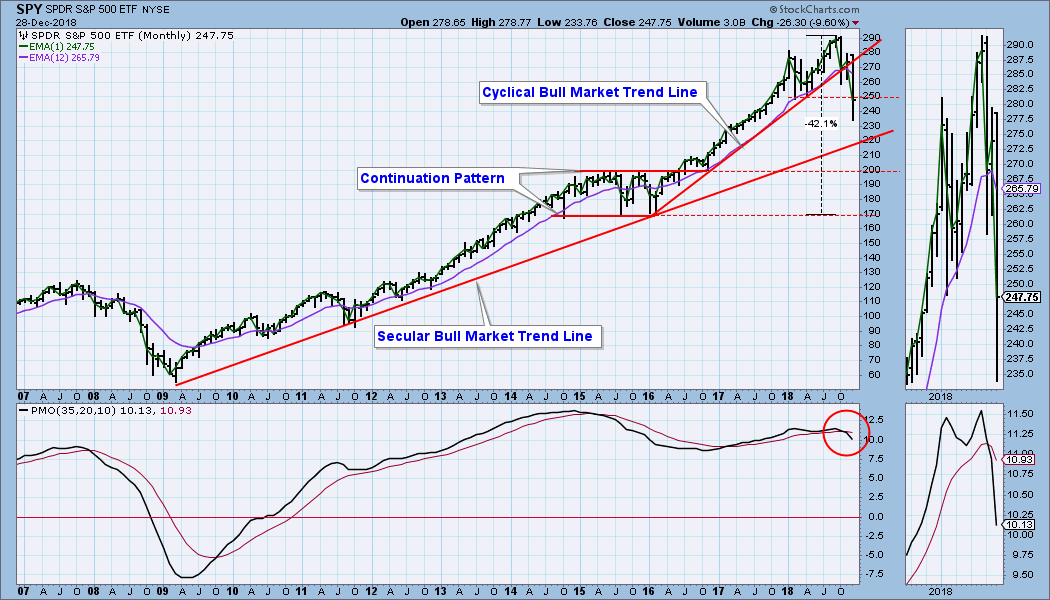
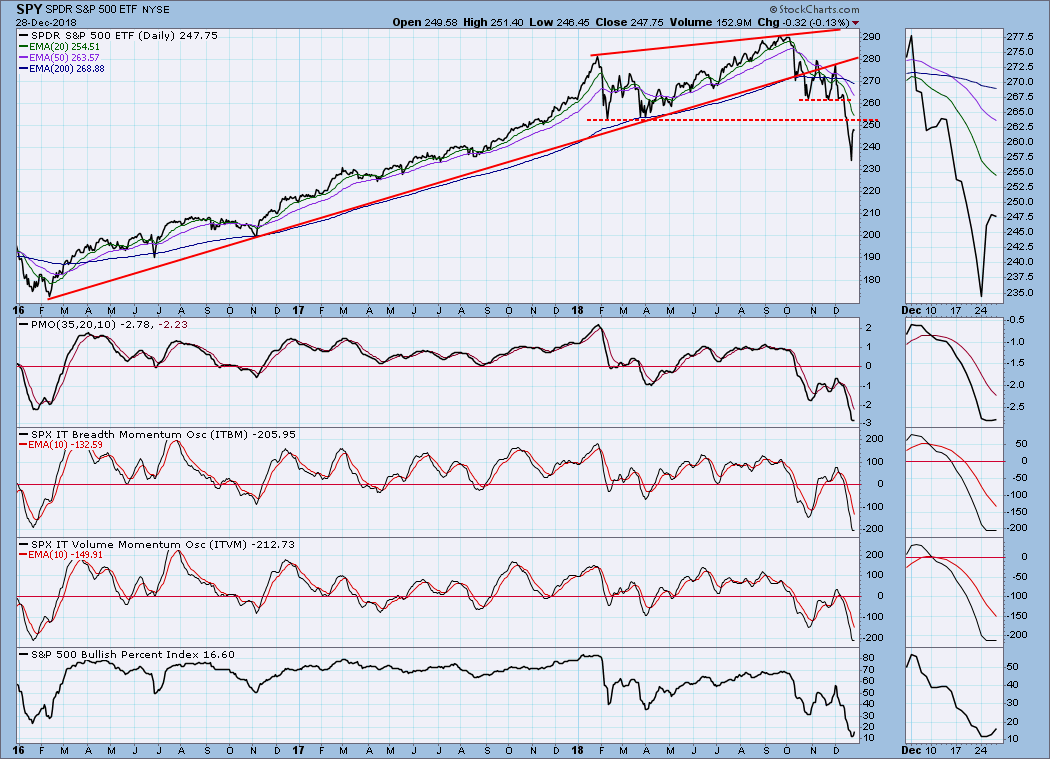
SPY Monthly Chart: The line drawn across the February low represents the most immediate overhead resistance. The next important support is on the secular bull market rising trend line; however, I favor the top and bottom of the 2015 consolidation pattern as a more credible zone of support. The monthly PMO is below the signal line and falling. This is very bearish.
Short-Term Market Indicators: While we need to be wary of oversold readings in a bear market, deeply oversold readings have a high probability of sparking a rally. On Monday the STO-B and STO-V had the lowest readings seen in almost three years.
Intermediate-Term Market Indicators: These indicators have reached the low side of their normal range, so, as with the short-term indicators, it is not surprising that prices rallied this week.
CONCLUSION: I continue to believe that we are in a bear market. In a bull market an oversold, short-covering rally would mark the end of whatever correction may have been taking place; however, in a bear market oversold readings, as we have just witnessed, are more than likely initiation markers, showing the end of the first downside impulse. As I look at the marked deceleration that took place on Thursday and Friday, it is not hard to imagine seeing a resumption of the selling next week. That is not a prediction, but I'll bet most people are not expecting it. It being another holiday week could mean a continuation of the wackiness.
Information posted to this board is not meant to suggest any specific action, but to point out the technical signs that can help our readers make their own specific decisions. Your Due Dilegence is a must! • DiscoverGold
Register for free to join our community of investors and share your ideas. You will also get access to streaming quotes, interactive charts, trades, portfolio, live options flow and more tools.


 News
News  Market Data
  Discover