


| Followers | 679 |
| Posts | 140823 |
| Boards Moderated | 36 |
| Alias Born | 03/10/2004 |
Monday, December 10, 2018 7:37:40 AM
Weekly Market Summary
By: Urban Carmel | December 8, 2018
Summary: Emerging markets are in a bear market. Europe and the Nasdaq are getting close. After falling 10% in October, SPX has been unable to sustain a rally. Even bearish sentiment, washed out breadth and the prospect of Santa Claus can't seem to rally stocks.
In real time, corrections always feel like they are the end of the bull market: the price pattern is bearish and the news emphasizes stories about a likely recession, poor forward earnings and geopolitical risks. Yet corrections usually happen every 18 months, and the current one has so far not been especially long or deep.
That is not to suggest that investors be complacent or dismissive of mounting risk. SPX had formed a topping pattern in August, and events since then have only strengthened this pattern. But there is little evidence of the underlying stress that is normally associated with big problems. For all the recent volatility, it is worth noting that the low in SPX was in October, 6 weeks ago. Everything since then has been a hot mess.
This is not a market trying to efficiently discount next year's growth; it's a market mostly driven by fear and emotion.
* * *
The correction from the September all-time high (ATH) is now in its 11th week. Aside from the NDX, all the US indices are now negative for the year. So are treasuries (TLT). What's worked well so far in 2018? Volatility, which is up more than 40% (table from alphatrends.net). Enlarge any chart by clicking on it.
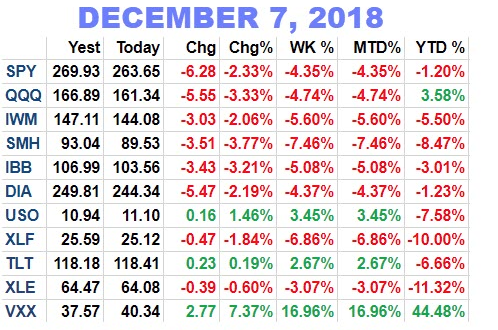
From their ATH, SPX and the Russell 3000 (which represents 98% of US market cap) have declined about 12%. NDX might still be positive for the year but it has also fallen the most in the past two months (16%).
As bad as this sounds, the US has outperformed the rest of the world. The MSWORLD index (which excludes the US) peaked in January and is now down 19%. Emerging markets have been hit the hardest (which is normal in a correction); Europe is down 15%.
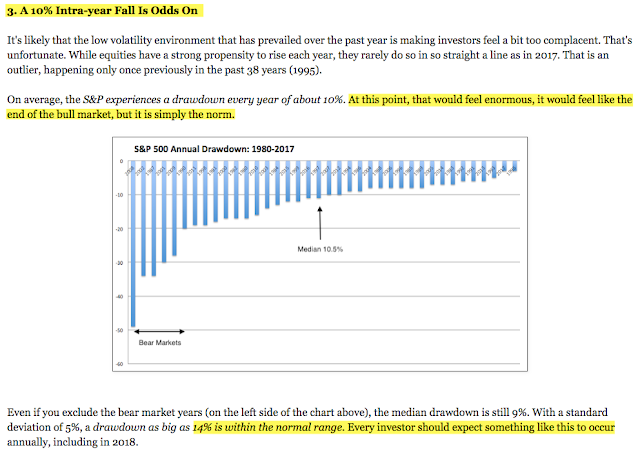
Annual falls of 10% are normal during the course of any year. Even 14% falls are within the normal range. But in real time, corrections always feel like they are the end of the bull market: the price pattern is bearish and the news emphasizes stories about a likely recession, poor forward earnings and geopolitical risks. This is not hindsight bias; our Outlook for 2018 emphasized the likelihood for exactly this outcome (here).
The correction is now in its 78th day. That's long, but not extreme. We don't know when this one will end, but there have been 4 corrections both longer and deeper than the current one since the 2009 low (table from Charlie Bilello as of October 26).

There is no doubt that recent volatility has been surprising. After falling 10% in October, SPX has rallied 6%, fallen 6%, rallied 6% and fallen 6%, all in the past six weeks. This week's 5% fall comes after last week's 5% rise and the prior week's 4% fall.
For all of this movement, it is worth noting that the low in SPX was in October, 6 weeks ago. All of the subsequent volatility has taken place within the 2600-2800 range. It's been a hot mess. The low has been tested 3 times and the high has also been tested 3 times. It's a good guess that whichever gets tested next (for the 4th time) is likely to break.
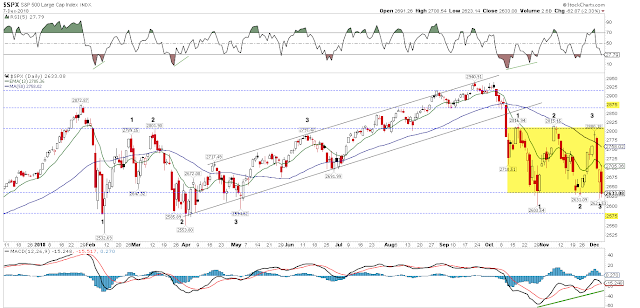
That makes the upcoming week a key one; below 2600 targets the February-April lows in the 2550-80 area. Be alert to a fake break, i.e., a break of 2600 that then reverses higher. That's the kind of move that triggers stops and marks capitulation, something that's been missing so far (note the long candle tails at the lows in February, April, May and October while Friday's candle lacks a tail).
The other end of the hot mess range (2800) has been a key demarkation level since February (note the 1, 2, 3s in the chart above). It's a good guess that the 4th attempt breaks higher and initiates a fear of missing out run higher to at least 2880. 2800 is also the 20-weekly MA (blue line) that we use delineate uptrends from downtrends. Equities are in a downtrend until that level is recaptured. Weekly highs in early November and this past week both stopped at that level.
In the chart above, note that down momentum (top panel) troughed in October. Subsequent retests of the lows have come on diminishing downward momentum. This supports a hypothesis that the last 6 weeks might have been a basing pattern.
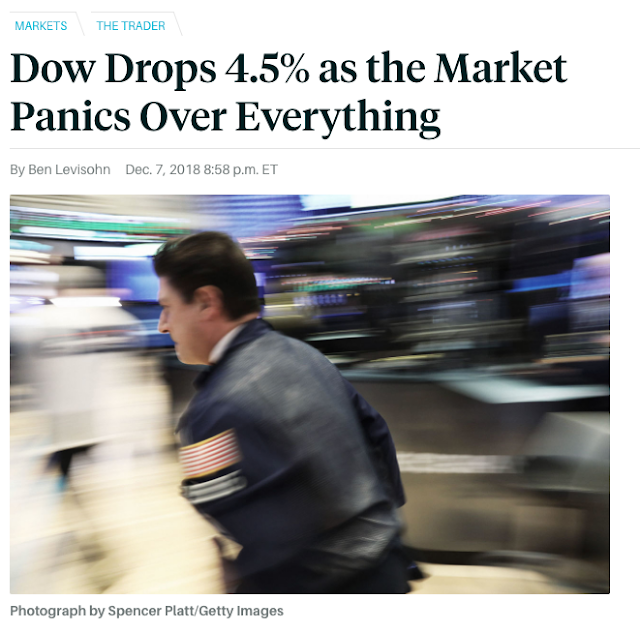
We call the last 6 weeks a 'hot mess' precisely because the movements are wild, erratic and prone to violent reversals. This is not a market trying to efficiently discount next year's growth; it's a market driven by fear and emotion (from Barron's).
By itself, these swings are not a feature that are exclusive to bear markets. The number of up and down daily moves is on par with bull market years like 1988, the late 1990s and 2010, 2011 and 2015. In real time, it feels scary but this is not unusual, it's just very different from last year's placid ride higher (table from Charlie Bilello).

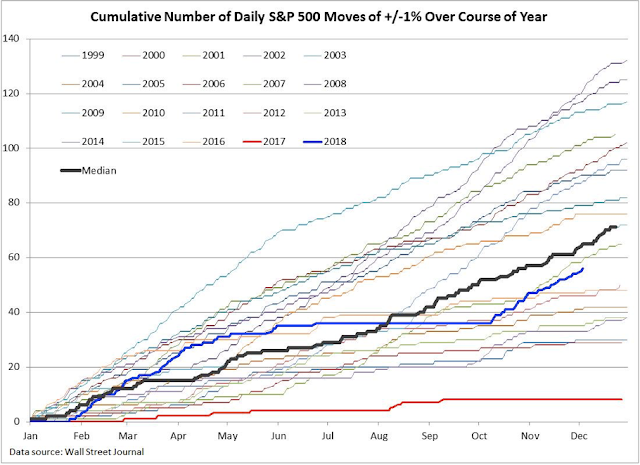
Over the past 20 years, daily volatility has more often been higher than what has so far been seen in 2018 (the black line is the median of all years). The red line at the bottom is 2017, the calmest year since the mid-1990s. 2018 seems like an outlier because 2017 was the actual outlier (from Willie Delwiche).
That SPX fell in October and then retested those lows in November (and December) is not surprising. The initial down momentum was too strong to dissipate quickly. At least one subsequent retest was strongly odds on (posts on that are here and here).
What is now becoming surprising, however, is the inability of equities to sustain gains for more than a week. The recent extremes in some measures of sentiment have normally led to a multi-week rally. So far, rallies have ended after just 6 days (twice).
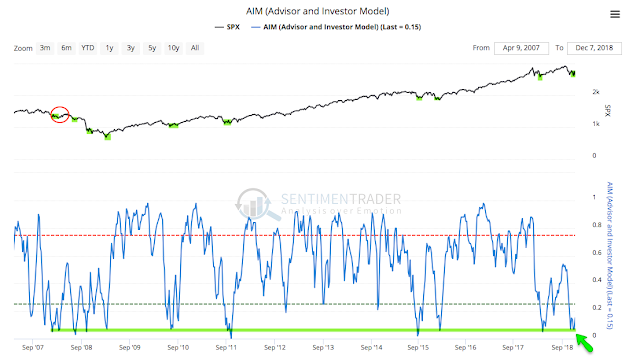
To take one example, the Advisor and Investor Model (AIM) from Sentimentrader, which combines sentiment survey data from several sources, first indicated a bearish extreme in early November. Since 2009, sentiment has not been much worse and in each case, an equity low was close and risk-reward was strongly skewed higher. Even in early 2008, a two month rally of more than 10% ensued (circle; from Sentimentrader; to become a subscriber and support the Fat Pitch, click here).
In contrast, this time, after several strong but failed rallies, SPX is now 3% lower. It's encouraging that investors haven't become more bullish, but it's a bad sign when equities won't rally with bearish sentiment. The time has come for this to matter or a different investing environment has probably arrived.
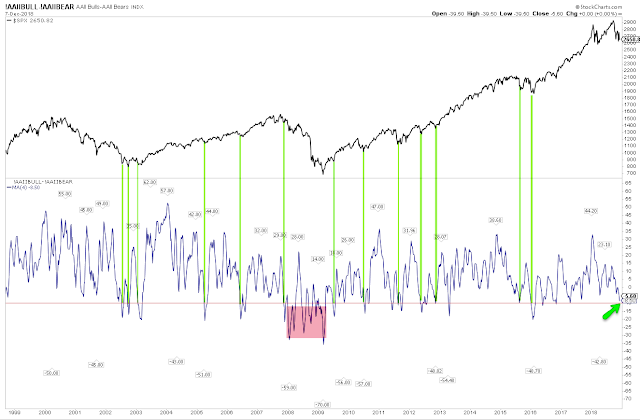
One of the inputs into AIM is the AAII retail investor survey, shown below over the past 20 years with a 4-week moving average. By the time sentiment has reached current levels, SPX has been near at least a temporary low. In the 2008 bear market, bearish extremes led only to failed rallies (red box).
Read More »»»
• DiscoverGold
By: Urban Carmel | December 8, 2018
Summary: Emerging markets are in a bear market. Europe and the Nasdaq are getting close. After falling 10% in October, SPX has been unable to sustain a rally. Even bearish sentiment, washed out breadth and the prospect of Santa Claus can't seem to rally stocks.
In real time, corrections always feel like they are the end of the bull market: the price pattern is bearish and the news emphasizes stories about a likely recession, poor forward earnings and geopolitical risks. Yet corrections usually happen every 18 months, and the current one has so far not been especially long or deep.
That is not to suggest that investors be complacent or dismissive of mounting risk. SPX had formed a topping pattern in August, and events since then have only strengthened this pattern. But there is little evidence of the underlying stress that is normally associated with big problems. For all the recent volatility, it is worth noting that the low in SPX was in October, 6 weeks ago. Everything since then has been a hot mess.
This is not a market trying to efficiently discount next year's growth; it's a market mostly driven by fear and emotion.
* * *
The correction from the September all-time high (ATH) is now in its 11th week. Aside from the NDX, all the US indices are now negative for the year. So are treasuries (TLT). What's worked well so far in 2018? Volatility, which is up more than 40% (table from alphatrends.net). Enlarge any chart by clicking on it.

From their ATH, SPX and the Russell 3000 (which represents 98% of US market cap) have declined about 12%. NDX might still be positive for the year but it has also fallen the most in the past two months (16%).
As bad as this sounds, the US has outperformed the rest of the world. The MSWORLD index (which excludes the US) peaked in January and is now down 19%. Emerging markets have been hit the hardest (which is normal in a correction); Europe is down 15%.
Annual falls of 10% are normal during the course of any year. Even 14% falls are within the normal range. But in real time, corrections always feel like they are the end of the bull market: the price pattern is bearish and the news emphasizes stories about a likely recession, poor forward earnings and geopolitical risks. This is not hindsight bias; our Outlook for 2018 emphasized the likelihood for exactly this outcome (here).

The correction is now in its 78th day. That's long, but not extreme. We don't know when this one will end, but there have been 4 corrections both longer and deeper than the current one since the 2009 low (table from Charlie Bilello as of October 26).

There is no doubt that recent volatility has been surprising. After falling 10% in October, SPX has rallied 6%, fallen 6%, rallied 6% and fallen 6%, all in the past six weeks. This week's 5% fall comes after last week's 5% rise and the prior week's 4% fall.
For all of this movement, it is worth noting that the low in SPX was in October, 6 weeks ago. All of the subsequent volatility has taken place within the 2600-2800 range. It's been a hot mess. The low has been tested 3 times and the high has also been tested 3 times. It's a good guess that whichever gets tested next (for the 4th time) is likely to break.

That makes the upcoming week a key one; below 2600 targets the February-April lows in the 2550-80 area. Be alert to a fake break, i.e., a break of 2600 that then reverses higher. That's the kind of move that triggers stops and marks capitulation, something that's been missing so far (note the long candle tails at the lows in February, April, May and October while Friday's candle lacks a tail).
The other end of the hot mess range (2800) has been a key demarkation level since February (note the 1, 2, 3s in the chart above). It's a good guess that the 4th attempt breaks higher and initiates a fear of missing out run higher to at least 2880. 2800 is also the 20-weekly MA (blue line) that we use delineate uptrends from downtrends. Equities are in a downtrend until that level is recaptured. Weekly highs in early November and this past week both stopped at that level.

In the chart above, note that down momentum (top panel) troughed in October. Subsequent retests of the lows have come on diminishing downward momentum. This supports a hypothesis that the last 6 weeks might have been a basing pattern.
We call the last 6 weeks a 'hot mess' precisely because the movements are wild, erratic and prone to violent reversals. This is not a market trying to efficiently discount next year's growth; it's a market driven by fear and emotion (from Barron's).

By itself, these swings are not a feature that are exclusive to bear markets. The number of up and down daily moves is on par with bull market years like 1988, the late 1990s and 2010, 2011 and 2015. In real time, it feels scary but this is not unusual, it's just very different from last year's placid ride higher (table from Charlie Bilello).

Over the past 20 years, daily volatility has more often been higher than what has so far been seen in 2018 (the black line is the median of all years). The red line at the bottom is 2017, the calmest year since the mid-1990s. 2018 seems like an outlier because 2017 was the actual outlier (from Willie Delwiche).

That SPX fell in October and then retested those lows in November (and December) is not surprising. The initial down momentum was too strong to dissipate quickly. At least one subsequent retest was strongly odds on (posts on that are here and here).
What is now becoming surprising, however, is the inability of equities to sustain gains for more than a week. The recent extremes in some measures of sentiment have normally led to a multi-week rally. So far, rallies have ended after just 6 days (twice).
To take one example, the Advisor and Investor Model (AIM) from Sentimentrader, which combines sentiment survey data from several sources, first indicated a bearish extreme in early November. Since 2009, sentiment has not been much worse and in each case, an equity low was close and risk-reward was strongly skewed higher. Even in early 2008, a two month rally of more than 10% ensued (circle; from Sentimentrader; to become a subscriber and support the Fat Pitch, click here).

In contrast, this time, after several strong but failed rallies, SPX is now 3% lower. It's encouraging that investors haven't become more bullish, but it's a bad sign when equities won't rally with bearish sentiment. The time has come for this to matter or a different investing environment has probably arrived.
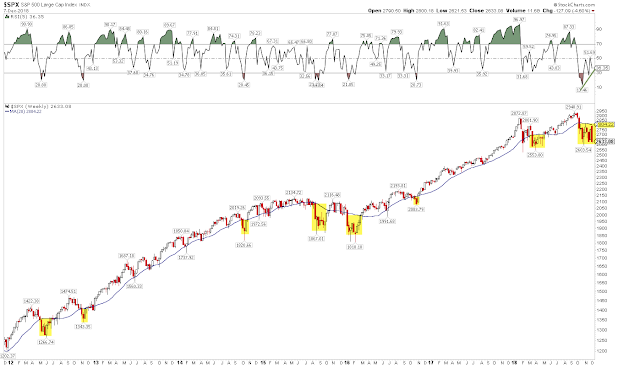
One of the inputs into AIM is the AAII retail investor survey, shown below over the past 20 years with a 4-week moving average. By the time sentiment has reached current levels, SPX has been near at least a temporary low. In the 2008 bear market, bearish extremes led only to failed rallies (red box).

Read More »»»
• DiscoverGold
Information posted to this board is not meant to suggest any specific action, but to point out the technical signs that can help our readers make their own specific decisions. Your Due Dilegence is a must!
• DiscoverGold
Join the InvestorsHub Community
Register for free to join our community of investors and share your ideas. You will also get access to streaming quotes, interactive charts, trades, portfolio, live options flow and more tools.

