


| Followers | 679 |
| Posts | 140818 |
| Boards Moderated | 36 |
| Alias Born | 03/10/2004 |
Monday, November 19, 2018 8:19:42 AM
Stocks Attempting To Form Base – This Week’s Action Could Provide Further Clues
By: Hedgopia | November 19, 2018
There are signs of macro deceleration. Equities may be starting to price this in, but are not panicking. If the S&P 500 rallies near term, how investors behave around 2800 can signal what kind of deceleration lies ahead.
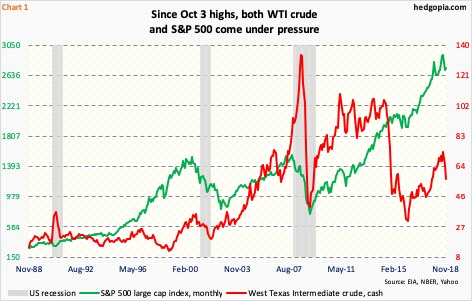
On October 3, the S&P 500 large cap index (2736.27) rallied to within 1.06 points of surpassing the all-time high of 2940.91 set on September 21, just before beginning a nearly waterfall dive. By October 29, the index was down to 2603.54. The beginning of the unraveling in the S&P 500 coincided with a peak in spot West Texas Intermediate crude (Chart 1).
Also on October 3, the crude ($56.68/barrel) rallied intraday to $76.90, which was just a month short of a four-year high. A weekly shooting star showed up in that week, followed by six straight negative weeks.
Last Tuesday, WTI fell to $54.75 intraday, and tried to stabilize in the latter part of the week. During this rout, it lost trend-line support from February 2016. Back then, the crude bottomed at $26.05, before beginning a multi-year rally. The daily chart remains extremely oversold. The underside of that broken trend line gets tested around $60. It will be an important test near term. Medium- to longer-term, the question is, is oil trying to say something about global demand with a quick 29-percent drop?
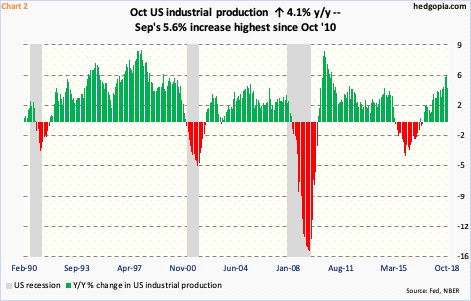
In the US, things could not be perkier at the moment. Real GDP expanded 4.2 percent in 2Q18 and 3.5 percent in 3Q. As of last Thursday, the Atlanta Fed’s GDPNow model was forecasting 2.5-percent growth in 4Q. The ISM manufacturing index in October fell 2.1 points month-over-month to 57.7; August’s 61.3 was the highest since May 2004. After nearly two years of year-over-year contraction, industrial production went positive in March 2017. This September, production rose at a 5.6-percent pace – an eight-year high – with October softening a tad to growth of 4.1 percent (Chart 2).
At the same time, a trend is developing here – visible in all these three data sets – which is that of a deceleration. In manufacturing, for instance, historically it is hard to sustain above 60. If so, then the question becomes, what kind of deceleration are we talking about here?
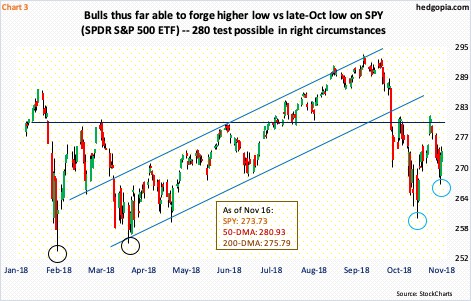
Equities seem bothered by it, but are not panicking. Between October 3 and 29, SPY (SPDR S&P 500 ETF) fell 11.4 percent intraday. Nothing in a big scheme of things. Just since the low of February 2016 through the all-time high of September this year, the ETF rallied in excess of 62 percent (Chart 3).
Last week, SPY ($273.73) shed 1.5 percent, but there were also signs that bulls were beginning to put their foot down. Last Thursday’s reversal may have come at a potentially important spot. If it holds, this would have meant a higher low versus the prior low of October 29. Early this year, a similar pattern set in motion a decent rally.
Immediately ahead, the 200-day moving average lies at $275.59. If it is recaptured this week, major resistance lies at $280, which has proven to be an important level the past nine months. In the past month, shorts got aggressive twice at that horizontal resistance. Currently, the rapidly dropping 50-day lies around there as well. Assuming a rally ensues near term but $280 continues to act as a ceiling, this can be taken as a sign that more investors are beginning to buy into fears of macro deceleration. In this scenario, they likely will begin to rerate next year’s earnings expectations.
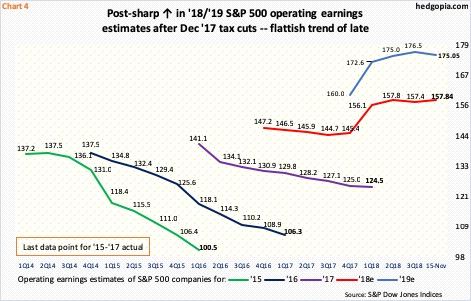
Next year’s estimates remain elevated. Last December, after the Tax Cuts and Jobs Act of 2017 was signed into law, operating earnings estimates for S&P 500 companies took off. On December 21, estimates for 2018 were $145.31. As of November 7, they were $158.26, flat with $158.24 on July 26. Similarly, 2019 estimates peaked at $177.13 on August 3, but these companies are still expected to haul in $175.05 (Chart 4).
It is normal for the sell-side to start out a year with optimism and then gradually lower estimates as time passes on. With one quarter to go, 2018 is flattish to slightly down; 2019 is holding up but even here estimates are beginning to stall. In the event of a serious macro deceleration, it is anyone’s guess as to what kind of a knife these estimates will come under.
This would have come at a time when foreigners are already shunning US stocks.
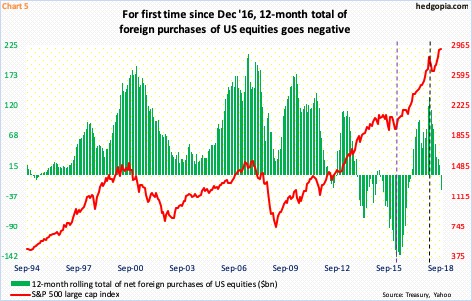
In September, foreigners sold $16.9 billion in US equities. This was five months in a row they were net sellers, for a total $101.6 billion.
Chart 5 uses a 12-month rolling total, and on that basis September saw net selling of $26.8 billion – the first time since December 2016 that foreigners sold. As early as January, they were buying $135.7 billion worth. That was the month the S&P 500 peaked before quickly dropping double digits (black dashed line).
This time around, the green bars went negative in September, yet this was a month in which the S&P 500 made a new high. Arguably, with the way October turned out, the index is catching up. Historically, the green bars and the red line have shown a tendency to move together. Noticeably, back in February 2016 when the S&P 500 reached an important bottom, foreigners were selling $145.3 billion worth – a record – before reversing (violet dashed line).
Their activity is worth a close watch.
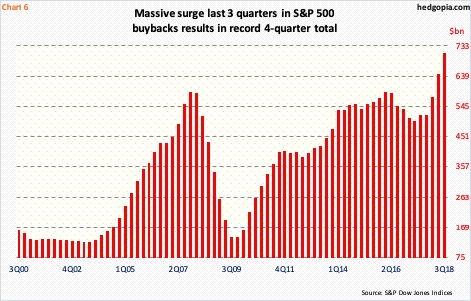
The lack of buying from foreigners has been more than offset by corporate buybacks – for now. In 3Q18, S&P 500 companies spent $194.1 billion in buybacks, which was a new record. S&P Dow Jones Indices points out that when it is all said and done 3Q18 could reach $200 billion.
Post last December’s corporate tax cuts, buybacks took off this year. The four-quarter total reached a massive $710.7 billion in 3Q18 (Chart 6). Buybacks have clearly been a saving grace. That said, with all the money spent this year, the S&P 500 only managed to rally 2.3 percent year-to-date.
In a scenario in which the US economy decelerates further, thereby adversely impacting corporate earnings, the current pace of buybacks is simply unsustainable. Of dividends and buybacks, managements, when pushed against the wall, prefer to cut the latter first.
This raises plenty of questions as to the medium- to long-term health of US stocks. The bull market is in its 10th year. Near term, assuming stocks are trying to form a base, opportunities may await nimble traders. This week’s action can be telling. Wait and watch for now.
Read More »»»
• DiscoverGold
Information posted to this board is not meant to suggest any specific action, but to point out the technical signs that can help our readers make their own specific decisions. Your Due Dilegence is a must!
• DiscoverGold
Join the InvestorsHub Community
Register for free to join our community of investors and share your ideas. You will also get access to streaming quotes, interactive charts, trades, portfolio, live options flow and more tools.

