Stocks Haven't Done This Since 2016 By: Schaeffer's Investment Research | November 7, 2018
What it means when S&P stocks achieve a selling climax
More than 10% of S&P stocks achieved a selling climax last week
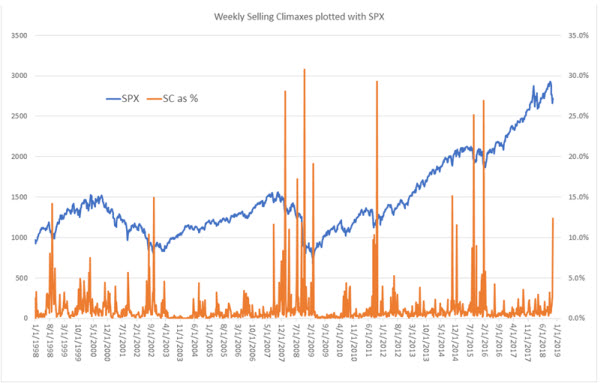
The stock market last week attempted to chip away at its steep October losses, with the S&P 500 Index (SPX) enjoying its best week since March. What's more, over 10% of SPX stocks achieved a "selling climax" -- something we haven't seen since January 2016. For the uninitiated, a selling climax occurs when a stock hits a 52-week low in intraweek trading, but eventually settles higher on the week. Below we discuss what this rare signal could mean for markets going forward.
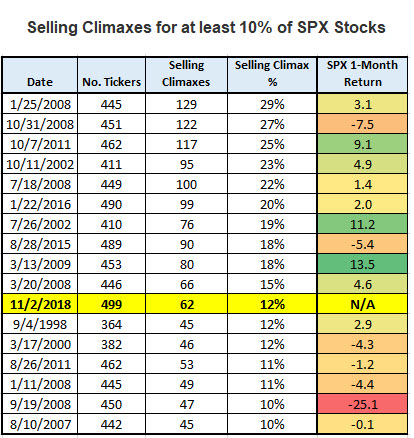
Specifically, 62 equities made a selling climax last week, representing 12.4% of the index, per Schaeffer's Quantitative Analyst Chris Prybal. There have been just 16 times where at least 10% of the SPX achieved a selling climax, looking at data since 1998. The biggest signal occurred in January 2008, when 29% of the index ended the week higher after touching a new low.
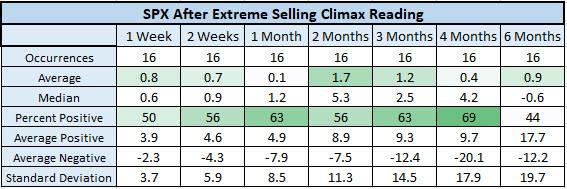
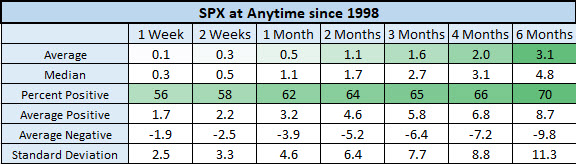
These signals have preceded stronger-than-usual price action for the S&P in the very short term, but weaker-than-usual momentum in the short-to-intermediate term. One and two weeks after signals, the SPX was up an average of 0.8% and 0.7%, respectively. That's compared to average anytime one- and two-week gains of 0.1% and 0.3%, looking at S&P data since 1998.
One month after signals, the SPX was up just 0.1%, on average, compared to 0.5% anytime. Four and six months later, the index averaged gains of just 0.4% and 0.9%, respectively, compared to 2% and 3.1% gains anytime. The broad-market barometer also tends to be more volatile than usual after signals, too, looking at the Standard Deviation rows in the charts below.
However, keep in mind that those longer-term returns are diluted by the 2008 financial crisis. In fact, six of the 16 signals above happened in 2008, and one occurred in August 2007. What's more, traders today have seasonality on their side. The SPX has been higher six months after midterm elections 100% of the time, looking at data since 1950, with an average gain of nearly 15%.
Information posted to this board is not meant to suggest any specific action, but to point out the technical signs that can help our readers make their own specific decisions. Your Due Dilegence is a must! • DiscoverGold
Register for free to join our community of investors and share your ideas. You will also get access to streaming quotes, interactive charts, trades, portfolio, live options flow and more tools.


 News
News  Market Data
  Discover