


| Followers | 679 |
| Posts | 140823 |
| Boards Moderated | 36 |
| Alias Born | 03/10/2004 |
Monday, August 13, 2018 8:13:11 AM
S&P 500 - 2 Steps Back To Take 3 Steps Forward?
By: Steve Deppe | August 12, 2018

The S&P 500 declined -0.25% this week with Friday's close at 2,833.28. The index's 5-week winning streak never made it to 6 as the combination of Trump and Turkey was clearly too much for participants to handle (sarcasm, kinda). 2,872.87 remains a top until it's not, and after trading up to 2,863.43 on Tuesday, 2,862.44 on Wednesday, and 2,862.48 on Thursday, an element of eager selling pressure revealed itself on Friday.
The trillion dollar question now is: double top or bullish breakout, what's next? The correct answer is unknowable as of today, but I'd speculate the answer is probably both as we look into the future. In other words, I think it's perfectly reasonable for the S&P 500 to take 1-2 steps back over the weeks ahead, which will embolden the double top crowd to pound the table a bit harder, only to then see the S&P 500 take 2-3 steps forward as we head into the fourth quarter of 2018.
2 Steps Back - Some Evidence
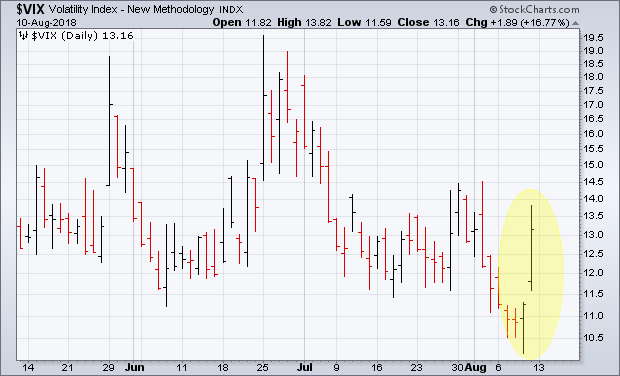
The idea behind taking 1-2 steps back at some point over the weeks ahead is supported by the S&P 500's price action the past few days. The S&P 500 ended the week closing red Wednesday through Friday, with Thursday and Friday illustrating ascending nervousness in the collective actions and behaviors of market participants. The Volatility Index (VIX) recorded a bullish outside reversal bar on Thursday, after trading down to 10.17, its lowest reading since January 12th. The VIX then ripped 16.77% on Friday alone to finish the week higher by 13.06%. With the VIX being a derivative of the actions and behaviors of market participants in options contracts for the S&P 500, Thursday and Friday's price action would seem to be indicative of a meaningful increase in participants' demand for put options contracts on the S&P 500. Behaviorally speaking, the past few days are analogous to the captain turning the seatbelt light on, and the passengers buckling up.
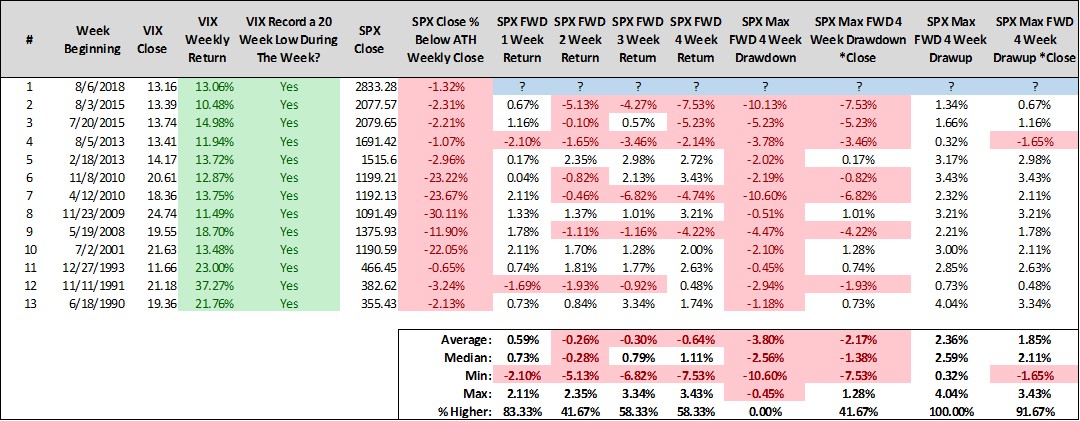
This week saw the VIX trade down to a 20-week low at the low of the week, yet finish the week higher by 10% or more. Since 1990, we have 12 prior trading weeks that fit this criteria, and the data set includes two of my least favorite memories - the first being August 2015's crash and the second being May 2010's "flash crash". Each of the last three samples have come from a stone's throw away from all-time highs, each of them occurred at and around the month of August, and each of them saw rather meaningful turbulence for the S&P 500 over the forward 1 month. I'd be remiss in not pointing out that the S&P 500's forward 1-week return following such instances has been higher 10 of 12 for median returns of 0.73%, so perhaps there's another week of smooth skies before things get a bit rocky.
We can also look at Friday's VIX explosion in isolation to quantify those instances where market participants showed ascending nervousness on a Friday. Since 1990, there are 24 prior Fridays where the VIX gained 10%, closed below 20, and the S&P 500 closed above its 200-day simple moving average. The S&P 500's average and median forward 10- and 20-day returns following such instances are red, with win rates of just 37.50% and 45.83%. Relative to all Fridays where the S&P 500 closed above its 200-day simple moving average, or all instances where the VIX gained 10% or more and closed below 20 on any other trading day but Friday, these forward returns are vastly inferior and include a who's who of corrective waves for the S&P 500 the last decade-plus.

There's an old phrase along the lines of "somebody always knows", and the way this week ended seems to suggest that participants know there's a bit of turbulence ahead. After all, It feels like things get a bit messy in August and/or September every year, so perhaps the narrative from this past week is participants simply taking advantage of cheap insurance before the potential turbulence actually arrives.
3 Steps Forward - Some Evidence
It's important to keep in mind that short-term turbulence for the S&P 500 is totally normal (remember last August? Click here to read what I wrote then). While the key to building a sizable following in the world of social media and the financial blogosphere is to scream about the possibility of the plane crashing at the first hint of turbulence (hello Zerohedge), the reality is that plane rarely ever crashes. Crashes are always possible, and investors must at least respect that possibility, but It's far more common that the turbulence comes, the turbulence goes, and the plane reaches its final destination to the north. It's important that long-term investors don't allow the focus to become the trees, as opposed to the forest. If we do take a few steps backward over the coming month, and perhaps trade down toward the ~2,740-2,780 price region, it's not a reason to panic or rush to press the sell button in my opinion. In fact, it's probably not a reason to do much of anything, except consider "buying the dip" in the event you have idle reserves available for investing and/or your current equity allocation across your investable portfolio is below its target weight given your individual investor preferences. The performance of the S&P 500, Russell 2000, and Nasdaq Composite over April, May, June, and July has set off a frenzy of "bullish" precedents that suggest the path of least resistance is meaningfully higher at some point over the remainder of 2018 or the first half of 2019.
First, the S&P 500 entered August on a four-month winning streak, having closed higher each of April, May, June, and July. Since 1950, there are just 10 prior calendar years that saw the S&P 500 close higher April through July, and in all 10 instances the tailwind kept blowing behind the S&P 500's back. Since 1950, following a four-month winning streak at July's close, the S&P 500's forward 4-, 5-, 6-, and 12-month returns are undefeated (i.e., the index has never closed lower) for average returns of 7.05%, 9.47%, 10.59%, and 16.10%. The minimum max forward 12-month drawup records at 9.02%, which means unless this time is different, the S&P 500 will trade up to ~3,070 at some point between July 31st of 2018 and July 31st of 2019. While this is a crime of small numbers, lacks a sound premise, and guarantees nothing, it does illustrate the eager buying interest demonstrated across the collective behavior and actions of market participants in the present - which in theory should only occur if collective expectations of market participants calls for higher prices for the S&P 500 and its constituents into the future (i.e., if you're buying 'em today it's because your work, whether fundamental, macroeconomic, technical, or some form of voodoo, is leading you to believe they're worth more tomorrow).

The S&P 500's decisive win in the month of July also puts the bulls up 5 rounds to 2 on the scorecards through July's close (click here to read my post from July if the boxing analogy eludes you). The S&P 500 battered the bears in July; they pushed 'em into the corner and dodged the counter the bears had become accustomed to landing the second half of the month. Since 1950, we have 32 prior calendar years where the S&P 500 closed higher at least 5 of the first 7 months of the year, in any sequence, and the S&P 500's return the remainder of the calendar year closed higher 30 of 32 instances for median returns of 5.62%. With July's close at 2,816.29, this would target a 2018 close at ~2,974. There's only one top in the data set (July of 1959), and 31 of 32 samples saw the S&P 500 trade up by at least 4.96% at some point over the forward 1 year. A 4.96% drawup from July's close would mark a trade up toward ~2,955 at some point over the forward 1 year - and that's obviously a bullish breakout to a new all-time high for the S&P 500 as of today.

Turning our attention to the small caps, the Russell 2000 (RUT) recorded a 5-month winning streak as of July's close. Excluding overlapping samples, I've identified 13 prior 5-month winning streaks for the RUT since the late 1980s. RUT's forward 4-month returns have never closed lower; they're a perfect 13-0 for median returns of 3.42%. If the RUT's a barometer of risk appetite across market participants, then clearly market participants are hungry for the smallest of market capitalization stocks. The RUT has been showing some relative weakness the past few weeks, so perhaps that's an area already in the process of taking 1-2 steps back.

Finally, we have the Nasdaq Composite (COMPQ), the LeBron James of the equity markets, i.e., the best performing sector since things turned for the better in March of 2016. COMPQ has had no trouble recovering since February's correction, and COMPQ recorded an all-time high in the month of July. An all-time high in the month of July is often a time to buy in my opinion, and COMPQ's forward 1-year returns following Julys that record a fresh new all-time high are undefeated, a perfect 10-0, for median returns of a gaudy 19.52%. Almost exactly 1 year ago I shared a study for COMPQ that also sported 100% win rate over the forward 12 months, to which some of the bears told me "this time is different" (click here to revisit), yet here we are, one year later, and higher by more than 20%. There's a good chance the forward 1 year from here looks fairly similar, partially because nobody believes it will as of today. Sentiment is anything but "euphoric" in my opinion. For example, there was virtually no exuberance with Apple Inc.'s market capitalization crossing the trillion dollar mark.

Putting It All Together
The seatbelt light is on and there's turbulence in my forecast for the month ahead. However, I don't think the plane's going to crash; instead I think we're going to land at our destination titled "new all-time highs" over the months ahead. Our scheduled arrival has been delayed a few times this year, but I think we'll arrive nonetheless. Temporary downturns only interrupt the primary trend for the S&P 500, they don't end it.
As always, nothing I've shared here is predictive of what lies ahead, it's simply the view through the rear view mirror, where we have complete and total visibility into the past behavior of market participants. It's the view out of the windshield that is perpetually foggy, no matter how many times I used the word "never" or "undefeated" in this post. There's a first time for everything in the world of investing, and the price of the S&P 500 will trade beyond the limits of imagination. They say "never say never" for a reason.
That said, my work supports the idea that long-term investors are best served investing as if the best is yet to come - as if these studies I've shared are predictive of higher prices for the S&P 500 - while also being prepared as if the worst is just around the corner - as if the unprecedented times we live in will bring unprecedented price action. I believe investors are best served investing in the most traditional sense of the word, and not allowing the fear of striking out to keep them from playing the game. If given a choice between adhering to your long-term investing plan, or rebalancing your portfolio toward a combination of cash and bonds and waiting for armageddon, I'd suggest you pursue the former and not the latter. Armageddon is coming, it's always coming, but nobody can circle the date of its arrival. It's probably better to worry about it shortly after its arrival, when it's at least visible through the rear view mirror. Until then, relying on something like a 12-month moving average (12MA) to dictate asset allocation decisions, using it as a bull-bear divide with maniacal robotic-like discipline, can ensure you’re investing as if the best is yet to come, while also being prepared in the event the worst is truly around the corner. Think of the 12MA like your umbrella, and since markets exist in a climate where the threat of torrential downpour is always there, if you pack your umbrella you greatly reduce the odds of getting stuck and soaked, standing out helpless in the rain. It's always better to have a risk management plan and not need it, than need a risk management plan and not have it - and there's no better time to develop a risk management plan while the forecast calls for more sunshine.
https://steve-deppe.squarespace.com/blog/2018/8/10/sp-500-2-steps-back-to-take-3-steps-forward
• DiscoverGold
By: Steve Deppe | August 12, 2018

The S&P 500 declined -0.25% this week with Friday's close at 2,833.28. The index's 5-week winning streak never made it to 6 as the combination of Trump and Turkey was clearly too much for participants to handle (sarcasm, kinda). 2,872.87 remains a top until it's not, and after trading up to 2,863.43 on Tuesday, 2,862.44 on Wednesday, and 2,862.48 on Thursday, an element of eager selling pressure revealed itself on Friday.
The trillion dollar question now is: double top or bullish breakout, what's next? The correct answer is unknowable as of today, but I'd speculate the answer is probably both as we look into the future. In other words, I think it's perfectly reasonable for the S&P 500 to take 1-2 steps back over the weeks ahead, which will embolden the double top crowd to pound the table a bit harder, only to then see the S&P 500 take 2-3 steps forward as we head into the fourth quarter of 2018.
2 Steps Back - Some Evidence

The idea behind taking 1-2 steps back at some point over the weeks ahead is supported by the S&P 500's price action the past few days. The S&P 500 ended the week closing red Wednesday through Friday, with Thursday and Friday illustrating ascending nervousness in the collective actions and behaviors of market participants. The Volatility Index (VIX) recorded a bullish outside reversal bar on Thursday, after trading down to 10.17, its lowest reading since January 12th. The VIX then ripped 16.77% on Friday alone to finish the week higher by 13.06%. With the VIX being a derivative of the actions and behaviors of market participants in options contracts for the S&P 500, Thursday and Friday's price action would seem to be indicative of a meaningful increase in participants' demand for put options contracts on the S&P 500. Behaviorally speaking, the past few days are analogous to the captain turning the seatbelt light on, and the passengers buckling up.
This week saw the VIX trade down to a 20-week low at the low of the week, yet finish the week higher by 10% or more. Since 1990, we have 12 prior trading weeks that fit this criteria, and the data set includes two of my least favorite memories - the first being August 2015's crash and the second being May 2010's "flash crash". Each of the last three samples have come from a stone's throw away from all-time highs, each of them occurred at and around the month of August, and each of them saw rather meaningful turbulence for the S&P 500 over the forward 1 month. I'd be remiss in not pointing out that the S&P 500's forward 1-week return following such instances has been higher 10 of 12 for median returns of 0.73%, so perhaps there's another week of smooth skies before things get a bit rocky.

We can also look at Friday's VIX explosion in isolation to quantify those instances where market participants showed ascending nervousness on a Friday. Since 1990, there are 24 prior Fridays where the VIX gained 10%, closed below 20, and the S&P 500 closed above its 200-day simple moving average. The S&P 500's average and median forward 10- and 20-day returns following such instances are red, with win rates of just 37.50% and 45.83%. Relative to all Fridays where the S&P 500 closed above its 200-day simple moving average, or all instances where the VIX gained 10% or more and closed below 20 on any other trading day but Friday, these forward returns are vastly inferior and include a who's who of corrective waves for the S&P 500 the last decade-plus.

There's an old phrase along the lines of "somebody always knows", and the way this week ended seems to suggest that participants know there's a bit of turbulence ahead. After all, It feels like things get a bit messy in August and/or September every year, so perhaps the narrative from this past week is participants simply taking advantage of cheap insurance before the potential turbulence actually arrives.
3 Steps Forward - Some Evidence
It's important to keep in mind that short-term turbulence for the S&P 500 is totally normal (remember last August? Click here to read what I wrote then). While the key to building a sizable following in the world of social media and the financial blogosphere is to scream about the possibility of the plane crashing at the first hint of turbulence (hello Zerohedge), the reality is that plane rarely ever crashes. Crashes are always possible, and investors must at least respect that possibility, but It's far more common that the turbulence comes, the turbulence goes, and the plane reaches its final destination to the north. It's important that long-term investors don't allow the focus to become the trees, as opposed to the forest. If we do take a few steps backward over the coming month, and perhaps trade down toward the ~2,740-2,780 price region, it's not a reason to panic or rush to press the sell button in my opinion. In fact, it's probably not a reason to do much of anything, except consider "buying the dip" in the event you have idle reserves available for investing and/or your current equity allocation across your investable portfolio is below its target weight given your individual investor preferences. The performance of the S&P 500, Russell 2000, and Nasdaq Composite over April, May, June, and July has set off a frenzy of "bullish" precedents that suggest the path of least resistance is meaningfully higher at some point over the remainder of 2018 or the first half of 2019.
First, the S&P 500 entered August on a four-month winning streak, having closed higher each of April, May, June, and July. Since 1950, there are just 10 prior calendar years that saw the S&P 500 close higher April through July, and in all 10 instances the tailwind kept blowing behind the S&P 500's back. Since 1950, following a four-month winning streak at July's close, the S&P 500's forward 4-, 5-, 6-, and 12-month returns are undefeated (i.e., the index has never closed lower) for average returns of 7.05%, 9.47%, 10.59%, and 16.10%. The minimum max forward 12-month drawup records at 9.02%, which means unless this time is different, the S&P 500 will trade up to ~3,070 at some point between July 31st of 2018 and July 31st of 2019. While this is a crime of small numbers, lacks a sound premise, and guarantees nothing, it does illustrate the eager buying interest demonstrated across the collective behavior and actions of market participants in the present - which in theory should only occur if collective expectations of market participants calls for higher prices for the S&P 500 and its constituents into the future (i.e., if you're buying 'em today it's because your work, whether fundamental, macroeconomic, technical, or some form of voodoo, is leading you to believe they're worth more tomorrow).

The S&P 500's decisive win in the month of July also puts the bulls up 5 rounds to 2 on the scorecards through July's close (click here to read my post from July if the boxing analogy eludes you). The S&P 500 battered the bears in July; they pushed 'em into the corner and dodged the counter the bears had become accustomed to landing the second half of the month. Since 1950, we have 32 prior calendar years where the S&P 500 closed higher at least 5 of the first 7 months of the year, in any sequence, and the S&P 500's return the remainder of the calendar year closed higher 30 of 32 instances for median returns of 5.62%. With July's close at 2,816.29, this would target a 2018 close at ~2,974. There's only one top in the data set (July of 1959), and 31 of 32 samples saw the S&P 500 trade up by at least 4.96% at some point over the forward 1 year. A 4.96% drawup from July's close would mark a trade up toward ~2,955 at some point over the forward 1 year - and that's obviously a bullish breakout to a new all-time high for the S&P 500 as of today.

Turning our attention to the small caps, the Russell 2000 (RUT) recorded a 5-month winning streak as of July's close. Excluding overlapping samples, I've identified 13 prior 5-month winning streaks for the RUT since the late 1980s. RUT's forward 4-month returns have never closed lower; they're a perfect 13-0 for median returns of 3.42%. If the RUT's a barometer of risk appetite across market participants, then clearly market participants are hungry for the smallest of market capitalization stocks. The RUT has been showing some relative weakness the past few weeks, so perhaps that's an area already in the process of taking 1-2 steps back.

Finally, we have the Nasdaq Composite (COMPQ), the LeBron James of the equity markets, i.e., the best performing sector since things turned for the better in March of 2016. COMPQ has had no trouble recovering since February's correction, and COMPQ recorded an all-time high in the month of July. An all-time high in the month of July is often a time to buy in my opinion, and COMPQ's forward 1-year returns following Julys that record a fresh new all-time high are undefeated, a perfect 10-0, for median returns of a gaudy 19.52%. Almost exactly 1 year ago I shared a study for COMPQ that also sported 100% win rate over the forward 12 months, to which some of the bears told me "this time is different" (click here to revisit), yet here we are, one year later, and higher by more than 20%. There's a good chance the forward 1 year from here looks fairly similar, partially because nobody believes it will as of today. Sentiment is anything but "euphoric" in my opinion. For example, there was virtually no exuberance with Apple Inc.'s market capitalization crossing the trillion dollar mark.

Putting It All Together
The seatbelt light is on and there's turbulence in my forecast for the month ahead. However, I don't think the plane's going to crash; instead I think we're going to land at our destination titled "new all-time highs" over the months ahead. Our scheduled arrival has been delayed a few times this year, but I think we'll arrive nonetheless. Temporary downturns only interrupt the primary trend for the S&P 500, they don't end it.
As always, nothing I've shared here is predictive of what lies ahead, it's simply the view through the rear view mirror, where we have complete and total visibility into the past behavior of market participants. It's the view out of the windshield that is perpetually foggy, no matter how many times I used the word "never" or "undefeated" in this post. There's a first time for everything in the world of investing, and the price of the S&P 500 will trade beyond the limits of imagination. They say "never say never" for a reason.
That said, my work supports the idea that long-term investors are best served investing as if the best is yet to come - as if these studies I've shared are predictive of higher prices for the S&P 500 - while also being prepared as if the worst is just around the corner - as if the unprecedented times we live in will bring unprecedented price action. I believe investors are best served investing in the most traditional sense of the word, and not allowing the fear of striking out to keep them from playing the game. If given a choice between adhering to your long-term investing plan, or rebalancing your portfolio toward a combination of cash and bonds and waiting for armageddon, I'd suggest you pursue the former and not the latter. Armageddon is coming, it's always coming, but nobody can circle the date of its arrival. It's probably better to worry about it shortly after its arrival, when it's at least visible through the rear view mirror. Until then, relying on something like a 12-month moving average (12MA) to dictate asset allocation decisions, using it as a bull-bear divide with maniacal robotic-like discipline, can ensure you’re investing as if the best is yet to come, while also being prepared in the event the worst is truly around the corner. Think of the 12MA like your umbrella, and since markets exist in a climate where the threat of torrential downpour is always there, if you pack your umbrella you greatly reduce the odds of getting stuck and soaked, standing out helpless in the rain. It's always better to have a risk management plan and not need it, than need a risk management plan and not have it - and there's no better time to develop a risk management plan while the forecast calls for more sunshine.
https://steve-deppe.squarespace.com/blog/2018/8/10/sp-500-2-steps-back-to-take-3-steps-forward
• DiscoverGold
Information posted to this board is not meant to suggest any specific action, but to point out the technical signs that can help our readers make their own specific decisions. Your Due Dilegence is a must!
• DiscoverGold
Join the InvestorsHub Community
Register for free to join our community of investors and share your ideas. You will also get access to streaming quotes, interactive charts, trades, portfolio, live options flow and more tools.

