


| Followers | 679 |
| Posts | 140708 |
| Boards Moderated | 37 |
| Alias Born | 03/10/2004 |
Monday, July 16, 2018 8:06:04 AM
Early Signs Small-Caps Undergoing Subtle Change In Momentum
By: Hedgopia | July 16, 2018
There are some early signs markets are undergoing a subtle change – particularly as relates to the dynamics between small- and large-caps.
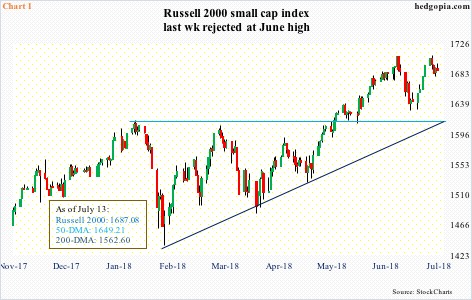
Right after Donald Trump was elected US president on November 8, 2016, small-caps became one of the go-to sectors for risk-on money. This continued this year. Late January, small-caps, along with stocks in general, peaked, followed by a sharp drop into a reversal low on February 9. Between an intraday high of 1615.52 on January 24 and that low, the Russell 2000 small cap index collapsed 11.1 percent in 13 sessions. This was followed by a lot of back-and-forth action, with higher lows, but a new high did not come until mid-May (Chart 1). Large-caps, in the meantime, were still stuck in a rut. Both the S&P 500 large cap index and the Dow Industrials are below their late-January highs.
Post-election, small-caps primarily benefited from two tailwinds. During election campaign, Trump promised to cut taxes and regulations as well as increase infrastructure spending. Small-caps inherently are domestically-focused, thus tend to benefit more from cuts in taxes and regulations than their large-cap brethren. At least that is the conventional wisdom. Because of their domestic focus, they are also perceived – rightly or wrongly – as immune from the fallout of the ongoing trade dispute between the US and China in particular.
Trump delivered on cuts in both taxes and regulations. In recent weeks/months, trade tensions have escalated. Yet, small-caps are beginning to act a little tired. The Russell 2000 (1687.08) last Monday rose to a new intraday high of 1708.56, but that was barely enough to surpass the prior high of 1708.10 from June 20. No breakout! Too soon to make too much of this, but this does represent a subtle change in small-caps’ character.
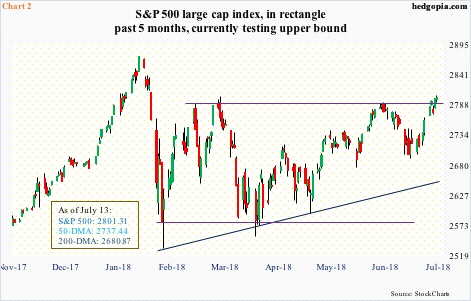
Small-caps’ rather lethargic behavior of late takes place even as the S&P 500 has managed to rally to an interesting juncture. As did the Russell 2000, the S&P 500 too has made higher lows since the February 9 low. As stated earlier, the latter is still below its all-time high of 2872.87 from January 26, which since has not been tested. Rally attempts persistently got stopped at 2800. Once again, the index (2801.31) finds itself at that level (Chart 2).
We are in the midst of 2Q earnings. A convincing breakout raises the odds the bulls would at least try to push the index toward the January high. This in the ‘for what it’s worth’ category. In the past five months, the S&P 500 has traded within a rectangle. A genuine breakout measures to 3000.
With that said, if early signs are any indication, the earnings season has hardly gotten off to a great start. Financials had already been acting poor. That did not change last Friday. Post-earnings, JP Morgan (JPM), Citigroup (C) and Wells Fargo (WFC) all fell.
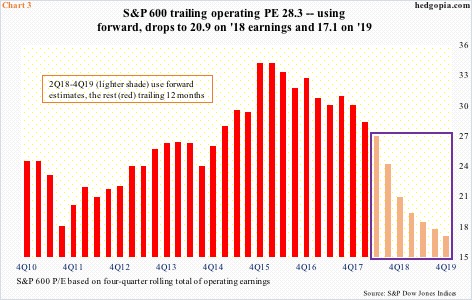
Speaking of earnings, since 2Q ended, 2018 operating earnings estimates for S&P 600 companies have gone down by $0.31 to $49.95. This is as of last Thursday. The high was recorded on March 22 when estimates peaked at $50.66. In 2017, these companies earned $31.19. Tax cuts provided a big boost to this year’s (and next) estimates.
The Tax Cuts and Jobs Act of 2017 was signed into law on December 22 last year. A day before that, 2018 estimates were $45.41. Consequently, using forward estimates, the price-to-earnings ratio looks a lot better than if one were to use trailing.
Chart 3 uses four-quarter rolling total. The seven quarters in the box portray forward P/E, reflecting the jump in 2018 and 2019 estimates, with the latter currently at $61.25. The question is, how reliable are 2019 estimates? Thus far, except in the past few weeks, they have been given the benefit of the doubt.
Small-caps, along with US stocks in general, reached a major low in February 2016. This coincided with a reversal in a downward trend lasting several quarters in S&P 600 earnings. On a four-quarter rolling total basis, earnings fell from $26.78 in 4Q14 to $19.66 in 4Q15. That was the bottom. Earnings began an uptrend in 1Q16.
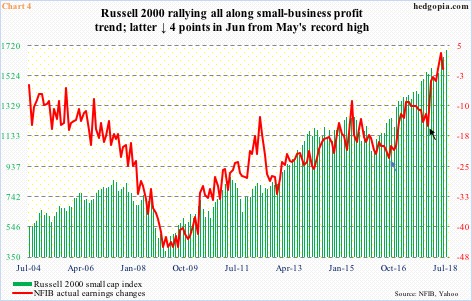
This phenomenon is also reflected in the National Federation of Independent Business’s sub-index of current profit trend. In August 2016, the red line in Chart 4 fell to minus 23 (blue arrow). Then there was another dip into December 2017 (black arrow), before going vertical. In May, ‘actual earnings changes’ rose to a new high of three, followed by a drop in June to minus one. As good as it gets? Once again, this is too soon to conclude. But it is definitely something to keep in the back of one’s mind, particularly considering how small-caps have behaved in recent weeks.
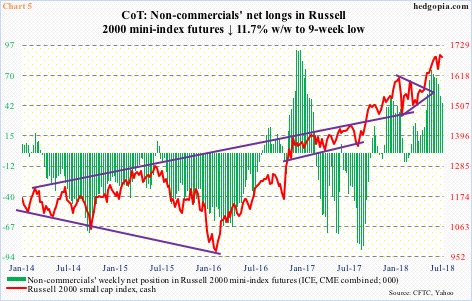
Incidentally, non-commercials have been cutting back on net longs in Russell 2000 futures for a while now. In the week through May 29, they held 74,239 contracts. By Tuesday last week, this had dwindled to 44,771 contracts – a nine-week low. More recently, in the week to June 19, these traders held 67,483 contracts. The cash peaked on June 20. This could very well be a case of the cash catching up with the futures. Time will tell.
For now, how things transpire as earnings roll out this week and next will be telling. The Russell 2000 remains overbought, but is still above shorter-term averages. The 20-day was tagged last Thursday. Near term, support lies at 1640-1650, and after that 1610-ish. The latter represents breakout retest and also approximates trend-line support from the aforementioned February low.
If fatigue continues this week, there may be tactical shorting opportunities. Wait and watch for now.
https://hedgopia.com/early-signs-small-caps-undergoing-subtle-change-in-momentum/
• DiscoverGold
By: Hedgopia | July 16, 2018
There are some early signs markets are undergoing a subtle change – particularly as relates to the dynamics between small- and large-caps.

Right after Donald Trump was elected US president on November 8, 2016, small-caps became one of the go-to sectors for risk-on money. This continued this year. Late January, small-caps, along with stocks in general, peaked, followed by a sharp drop into a reversal low on February 9. Between an intraday high of 1615.52 on January 24 and that low, the Russell 2000 small cap index collapsed 11.1 percent in 13 sessions. This was followed by a lot of back-and-forth action, with higher lows, but a new high did not come until mid-May (Chart 1). Large-caps, in the meantime, were still stuck in a rut. Both the S&P 500 large cap index and the Dow Industrials are below their late-January highs.
Post-election, small-caps primarily benefited from two tailwinds. During election campaign, Trump promised to cut taxes and regulations as well as increase infrastructure spending. Small-caps inherently are domestically-focused, thus tend to benefit more from cuts in taxes and regulations than their large-cap brethren. At least that is the conventional wisdom. Because of their domestic focus, they are also perceived – rightly or wrongly – as immune from the fallout of the ongoing trade dispute between the US and China in particular.
Trump delivered on cuts in both taxes and regulations. In recent weeks/months, trade tensions have escalated. Yet, small-caps are beginning to act a little tired. The Russell 2000 (1687.08) last Monday rose to a new intraday high of 1708.56, but that was barely enough to surpass the prior high of 1708.10 from June 20. No breakout! Too soon to make too much of this, but this does represent a subtle change in small-caps’ character.

Small-caps’ rather lethargic behavior of late takes place even as the S&P 500 has managed to rally to an interesting juncture. As did the Russell 2000, the S&P 500 too has made higher lows since the February 9 low. As stated earlier, the latter is still below its all-time high of 2872.87 from January 26, which since has not been tested. Rally attempts persistently got stopped at 2800. Once again, the index (2801.31) finds itself at that level (Chart 2).
We are in the midst of 2Q earnings. A convincing breakout raises the odds the bulls would at least try to push the index toward the January high. This in the ‘for what it’s worth’ category. In the past five months, the S&P 500 has traded within a rectangle. A genuine breakout measures to 3000.
With that said, if early signs are any indication, the earnings season has hardly gotten off to a great start. Financials had already been acting poor. That did not change last Friday. Post-earnings, JP Morgan (JPM), Citigroup (C) and Wells Fargo (WFC) all fell.

Speaking of earnings, since 2Q ended, 2018 operating earnings estimates for S&P 600 companies have gone down by $0.31 to $49.95. This is as of last Thursday. The high was recorded on March 22 when estimates peaked at $50.66. In 2017, these companies earned $31.19. Tax cuts provided a big boost to this year’s (and next) estimates.
The Tax Cuts and Jobs Act of 2017 was signed into law on December 22 last year. A day before that, 2018 estimates were $45.41. Consequently, using forward estimates, the price-to-earnings ratio looks a lot better than if one were to use trailing.
Chart 3 uses four-quarter rolling total. The seven quarters in the box portray forward P/E, reflecting the jump in 2018 and 2019 estimates, with the latter currently at $61.25. The question is, how reliable are 2019 estimates? Thus far, except in the past few weeks, they have been given the benefit of the doubt.

Small-caps, along with US stocks in general, reached a major low in February 2016. This coincided with a reversal in a downward trend lasting several quarters in S&P 600 earnings. On a four-quarter rolling total basis, earnings fell from $26.78 in 4Q14 to $19.66 in 4Q15. That was the bottom. Earnings began an uptrend in 1Q16.
This phenomenon is also reflected in the National Federation of Independent Business’s sub-index of current profit trend. In August 2016, the red line in Chart 4 fell to minus 23 (blue arrow). Then there was another dip into December 2017 (black arrow), before going vertical. In May, ‘actual earnings changes’ rose to a new high of three, followed by a drop in June to minus one. As good as it gets? Once again, this is too soon to conclude. But it is definitely something to keep in the back of one’s mind, particularly considering how small-caps have behaved in recent weeks.

Incidentally, non-commercials have been cutting back on net longs in Russell 2000 futures for a while now. In the week through May 29, they held 74,239 contracts. By Tuesday last week, this had dwindled to 44,771 contracts – a nine-week low. More recently, in the week to June 19, these traders held 67,483 contracts. The cash peaked on June 20. This could very well be a case of the cash catching up with the futures. Time will tell.
For now, how things transpire as earnings roll out this week and next will be telling. The Russell 2000 remains overbought, but is still above shorter-term averages. The 20-day was tagged last Thursday. Near term, support lies at 1640-1650, and after that 1610-ish. The latter represents breakout retest and also approximates trend-line support from the aforementioned February low.
If fatigue continues this week, there may be tactical shorting opportunities. Wait and watch for now.
https://hedgopia.com/early-signs-small-caps-undergoing-subtle-change-in-momentum/
• DiscoverGold
Information posted to this board is not meant to suggest any specific action, but to point out the technical signs that can help our readers make their own specific decisions. Your Due Dilegence is a must!
• DiscoverGold
Join the InvestorsHub Community
Register for free to join our community of investors and share your ideas. You will also get access to streaming quotes, interactive charts, trades, portfolio, live options flow and more tools.

