


Sunday, December 31, 2017 4:52:21 PM
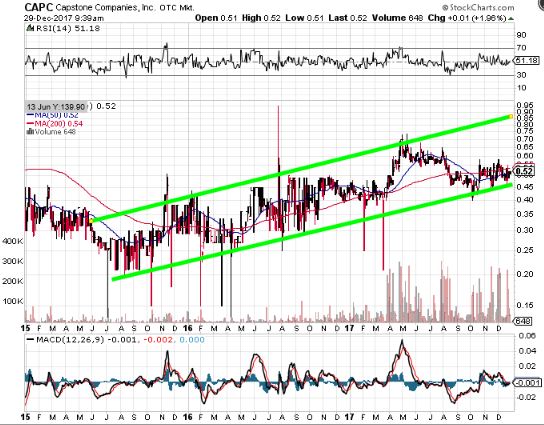
When the price drops, it drops just to the line and when it peaks, it peaks just to the line. The lines themselves have nothing to do with the price action but the fact that you can draw straight lines is the key to the "Pattern". Barring the few crazy one-off days the price action follows the pattern beautifully!
Now, the green lines clearly "Bound" the price action are roughly parallel, i.e. a "Channel". In this case the lines are sloping upward so we have an "Upward Channel". And that, my friend, is a beautiful thing!!
What we are looking for next is the price to rise up to the upper resistance line just like is has 4 times in the last 2 years, but instead of bouncing back down again, it will "Breakout" above the line in a sustainable way and continue upward. This breakout is what we want and it will be the start of a new chart pattern that you can bet I will bring to the board when it happens.
No, moving averages don't really play into a channel.
Yes, a pattern breakout would be above $.90 but $.75 is a price resistance level we have to get through first.
$CAPC is more on the radar than anytime within the last decade. Volume is up. New product on the way. IR will surely be intensified in 2018. All equals increased volume and price.
Recent CAPC News
- Form 10-Q - Quarterly report [Sections 13 or 15(d)] • Edgar (US Regulatory) • 11/14/2023 04:55:51 PM
- Form 10-Q - Quarterly report [Sections 13 or 15(d)] • Edgar (US Regulatory) • 08/14/2023 07:14:52 PM
- Form 8-K - Current report • Edgar (US Regulatory) • 07/03/2023 06:12:39 PM
Coinllectibles' Subsidiary, Grand Town Development Limited, Acquires Rare Song Dynasty Ceramics Worth Over USD28million • COSG • Apr 18, 2024 8:03 AM
ILUS Provides Form 10-K Filing Update • ILUS • Apr 17, 2024 9:54 AM
Glucotrack Announces Expansion of Its Continuous Glucose Monitoring Technology to Epidural Glucose Monitoring • GCTK • Apr 17, 2024 8:00 AM
Maybacks Global Entertainment To Fire Up 24 New Stations in Louisiana • AHRO • Apr 16, 2024 1:30 PM
Cannabix Technologies Begins Certification of Contactless Alcohol Breathalyzer, Re-Brands product series to Breath Logix • BLOZF • Apr 16, 2024 8:52 AM
Kona Gold Beverages, Inc. Acquires Surge Distribution LLC from Loud Beverage Group, Inc. (LBEV) • KGKG • Apr 16, 2024 8:30 AM

