Bull/Bear Market Rules and Head & Shoulders Patterns (UUP and TLT) By: Erin Heim | December 6, 2017
I'm sure many have heard the phrases, "Bull Market Rules Apply" or "Bear Market Rules Apply". I thought today I'd give you two examples of how these "rules" interact with chart patterns. In particular, a previous reverse head and shoulders on UUP and the break up of a head and shoulders pattern on TLT. Before I get to that, how do you determine which rules should be applied? Using DecisionPoint analysis, it's pretty easy.
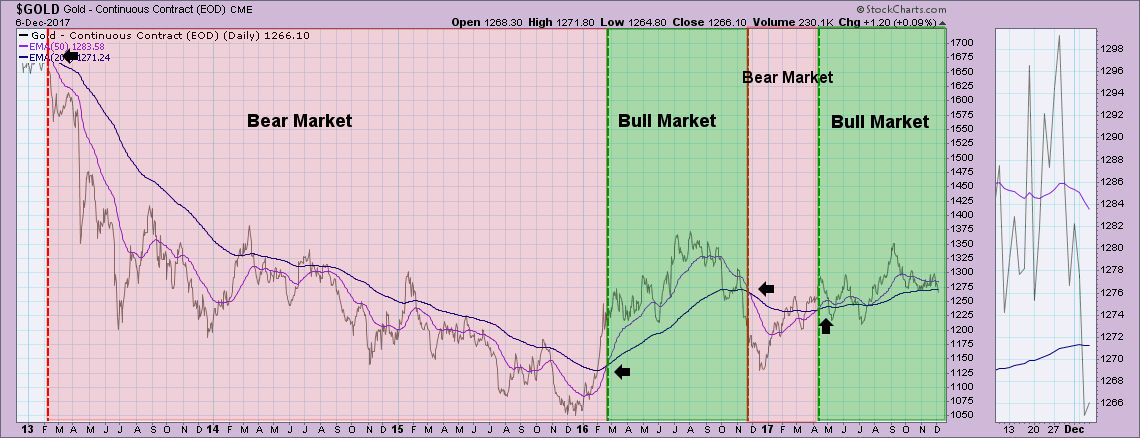
The DecisionPoint Long-Term Trend Model helps us to determine which rules to follow. The LT Trend Model triggers SELL signals when the 50-EMA crosses below the 200-EMA and it triggers a BUY signal when the 50-EMA crosses above the 200-EMA. Below is an example using Gold.
What are these bull/bear market rules anyway? The basic answer is this: If a stock/index/ETF is in a 'bull market', have bullish expectations. This includes not getting too bothered by overbought conditions. In a strong bull market, indicators and price can stay overbought for quite some time. In line with this thinking is not to expect bearish formations to execute properly in a bull market; and vice versa, bullish formations don't always execute properly in a bear market configuration. Granted these rules eventually don't work when the market shifts from bull to bear and vice versa. Watch the direction of the 50-EMA, it can give you some warning based on whether it is topping or bottoming. Additionally the IT Trend Model tracks 20/50-EMA crossovers. An IT BUY signal can clue you in that the bear market is coming to an end.
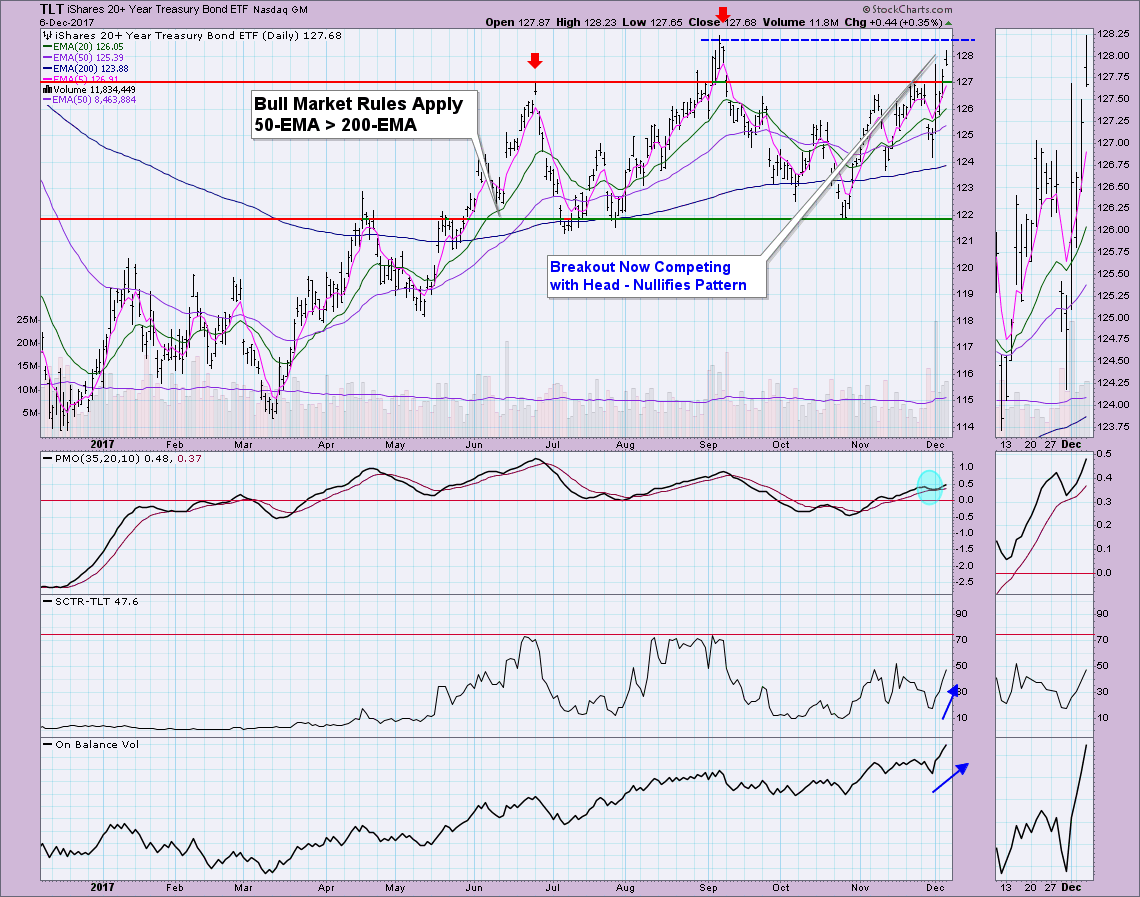
My first example is the formation of an intermediate-term head and shoulders pattern on TLT. With today's gap up, price is beginning to compete with the height of the head which nullifies the pattern in my opinion. Bull market rules began to apply back in June. While it was just fine for me to detect and watch for a bearish pattern on a bullish chart, the chances of it actually forming or executing are smaller given the location of the 50/200-EMAs. The breakout today is encouraging and while some may say that the H&S pattern is still viable, given the PMO rising and the nice accumulation we're seeing on the OBV, I suspect bonds will breakout above the September high. Given 'bull market rules', I actually should expect that conclusion.
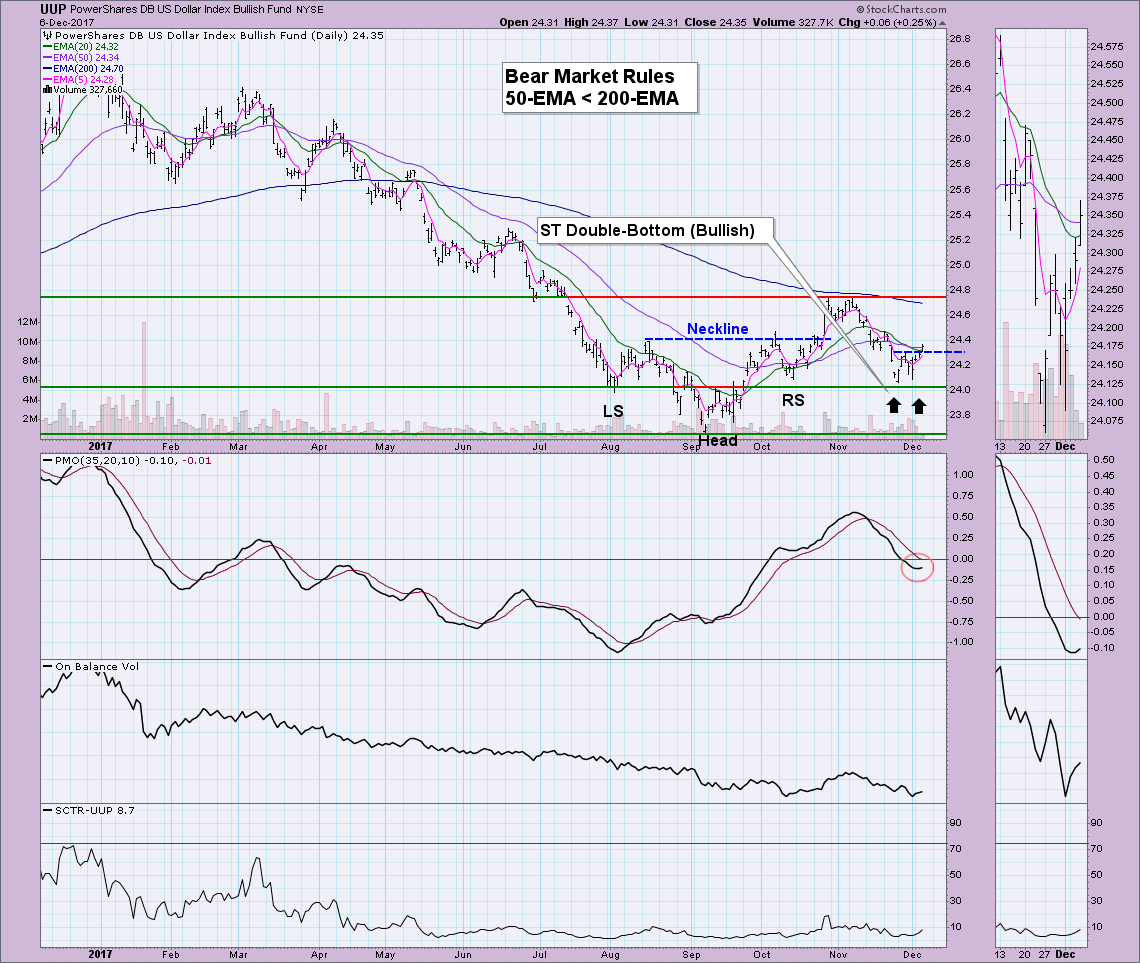
Now let's look at the reverse head and shoulders pattern that formed on UUP. The 50-EMA crossed below the 200-EMA back in May moving UUP into a "bear market". At that point, we should expect bearish conclusions to patterns and support, as well as not get too concerned about oversold extremes. The reverse head and shoulders did execute, but didn't get close to its upside target around $25.30 before turning back down. Now I'm noticing a short-term double-bottom. The neckline has been broken and the upside target would be around $24.60. The PMO is turning up which suggests that we could see this pattern reach its target. Ah, but what happens if it reaches or doesn't quite reach that upside target? A bearish head and shoulders would be forming. If this bullish double-bottom doesn't execute, we'll also see a bearish head and shoulders pattern.
Conclusion: These are guidelines that should help you with your analysis. As with anything regarding technical analysis, it isn't 100%. Bull market rules are one of the reasons my PMO scan includes the statement that the 50-EMA is above the 200-EMA. If the 50-EMA is above the 200-EMA I can have bullish expectations and that should increase my success on the trade.
Technical Analysis is a windsock, not a crystal ball.
• DiscoverGold (Disclosure: I do not have position in any of the above mentioned securities)
Information posted to this board is not meant to suggest any specific action, but to point out the technical signs that can help our readers make their own specific decisions. Your Due Dilegence is a must! • DiscoverGold
Register for free to join our community of investors and share your ideas. You will also get access to streaming quotes, interactive charts, trades, portfolio, live options flow and more tools.


 News
News  Market Data
  Discover