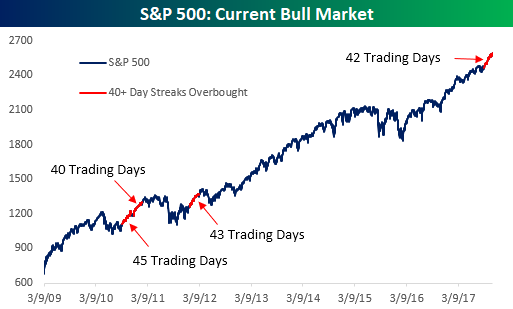
Longest Overbought Streak For S&P 500 Since 2012 By: Bespoke | November 7, 2017
Looking at the chart, the current streak of overbought closes is easily the longest of the last year, but looking further back at the current bull market, there have only been three other periods where the S&P 500 closed at overbought levels for 40 or more trading days. The chart below shows the S&P 500 through the course of the entire bull market dating back to March 2009. As shown, two of those prior streaks occurred within ten trading days of each other when a 45 trading day streak ended on 11/12/10 and another one began on 12/1/00. Besides those two streaks, the only other streak of 40 or more trading days was back in early 2012 when a 43 trading day streak came to an end in March 2012. Finally, while it may be hard to see on the chart, in both the one and six months that followed these prior streaks coming to an end, the S&P 500 was up all three times. Three months later the S&P 500 was up two out of three times with the one down period coming after the March 2012 streak when we saw a decline of 5.8%.
Information posted to this board is not meant to suggest any specific action, but to point out the technical signs that can help our readers make their own specific decisions. Your Due Dilegence is a must! • DiscoverGold
Register for free to join our community of investors and share your ideas. You will also get access to streaming quotes, interactive charts, trades, portfolio, live options flow and more tools.


 News
News  Market Data
  Discover