


| Followers | 679 |
| Posts | 140700 |
| Boards Moderated | 37 |
| Alias Born | 03/10/2004 |
Sunday, September 03, 2017 9:41:04 AM
By: Clive Maund | September 3, 2017
Price and volume action in gold in recent weeks has been very bullish indeed, as it moves towards completion of its giant 4-year long Head-and-Shoulders base pattern. We can see this to advantage on gold’s 10-year chart shown below. The volume pattern and volume indicators give the game away, and confirm that this is a genuine base pattern that will lead to a major new bullmarket in gold. Observe the volume build on the strong rise out of the lows of the “Head” of the pattern early last year, and how its even stronger on the rise this year out of the Right Shoulder low, and especially on the rally of recent weeks – the Accumulation - Distribution line has already reached its bullmarket highs of 2011, which is clearly a very positive sign. The new bullmarket hasn’t officially started yet of course and won’t until the price breaks out of the base pattern by breaking above the 1st band of resistance shown on the chart. That means that the days left to accumulate investments in this sector at good prices are numbered.

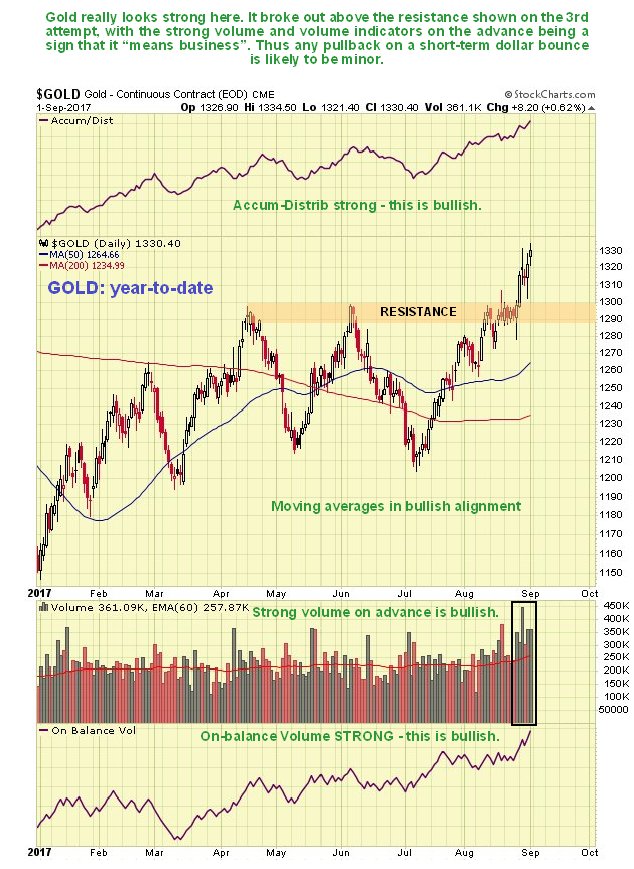
About a week ago it looked like gold was going to roll over again and play dead as it had arrived at an important zone of resistance at its April and June peaks as we can see on its year-to-date chart, with the risk of its doing so being increased by the potential for a dollar rebound, which we will come to later, but it didn’t – instead it broke above this resistance to advance on strong volume, which drove volume indicators sharply higher, a bullish development. This has given gold a buffer to buttress it in the event of a near-term dollar bounce.
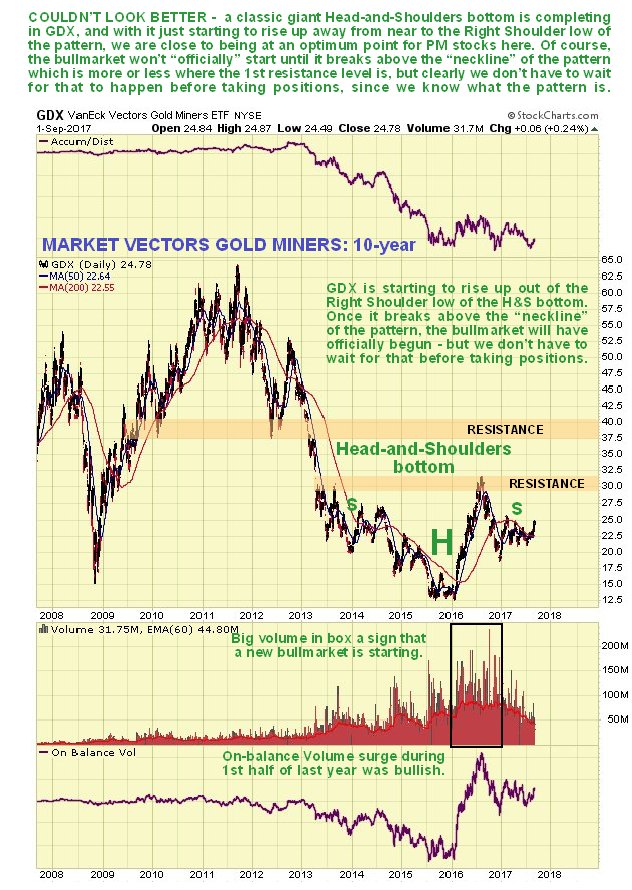
There is a parallel giant Head-and-Shoulders bottom pattern completing in gold stocks proxy GDX, as we can see on its 10-year chart below, and with the price still not far above the Right Shoulder low of the pattern and quite a way below its neckline (the 1st resistance level), we are still generally at a good point to accumulate Precious Metals stocks, as we have doing in recent weeks. The persistently high volume on the dramatic surge out of the lows of the Head of the pattern early last year was a sign that the bottom is in and was a very bullish development. The real big action will follow breakout above the 1st resistance level, although there will be considerable resistance to work through on the way up to the 2011 highs, but since the new sector bullmarket is set to be an order of magnitude greater than the last one, we can look forward to huge gains once GDX breaks out above its 2011 highs to new highs where there will be no further overhanging supply.
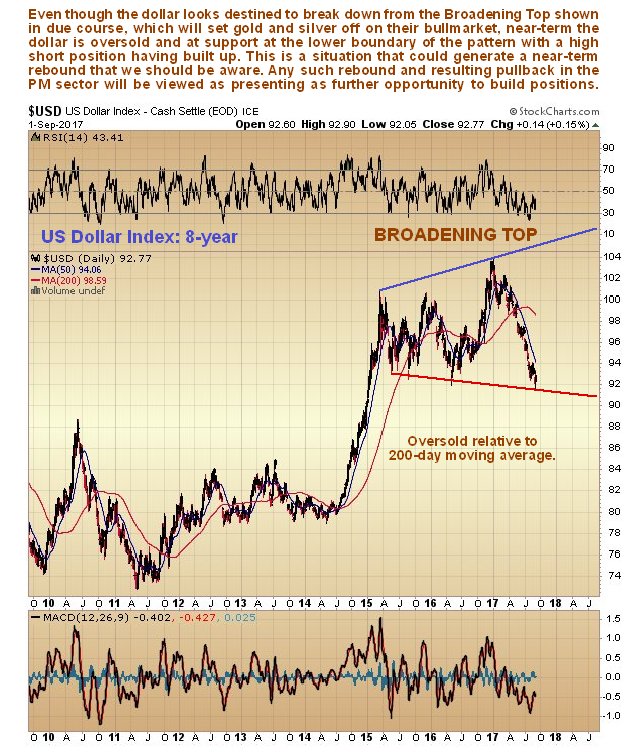
The gold charts that we have just looked at suggest that the dollar is destined for a serious breakdown, so now we will look at the latest dollar index chart to see what it portends. On the 8-year dollar index chart we can see that it has marked out a large Broadening Top over the past 2 years, which it is now threatening to break down from. However at this point is oversold and on support at the bottom of the pattern, making a near-term bounce likely, although if it happens, it probably won’t get very far.
Also pointing to a near-term dollar bounce is the latest Hedgers chart, which itself looks bullish for the dollar, and suggests that it is not ready to break down just yet. If it does bounce gold would be expected to pull back, but not by very much, to provide what will be probably turn out to be the last chance to accumulate the sector at favorable prices before the expected major bullmarket begins in earnest.
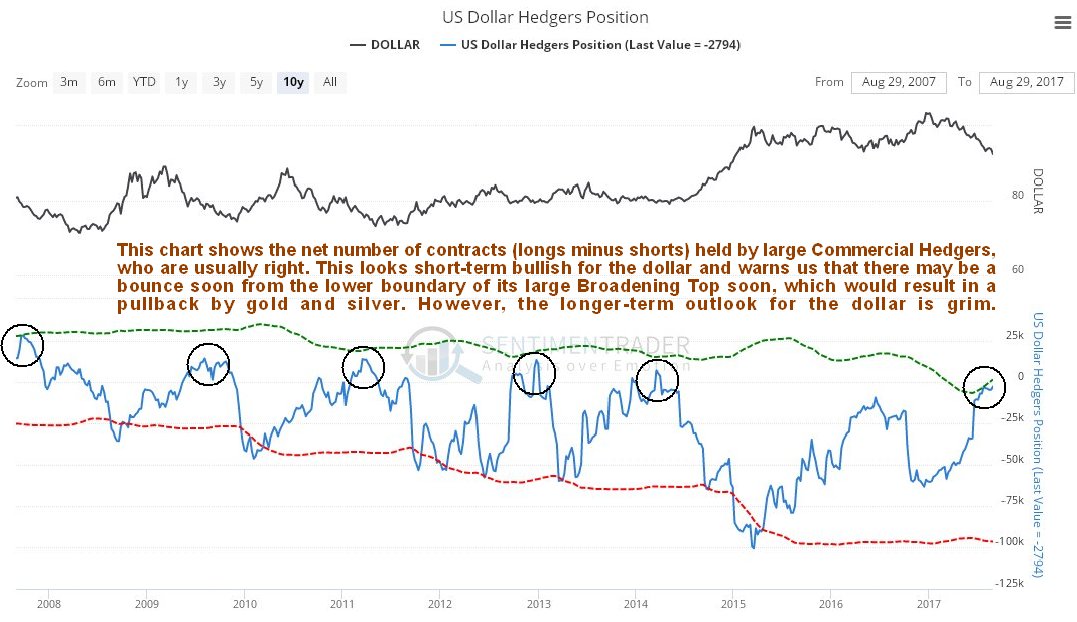
Chart courtesy of www.sentimentrader.com
https://www.clivemaund.com/free.php?id=68
• DiscoverGold
Click on "In reply to", for Authors past commentaries
*** For Market Direction and Trends visit our board:
https://investorshub.advfn.com/Market-Direction-and-Trends-26249/
Information posted to this board is not meant to suggest any specific action, but to point out the technical signs that can help our readers make their own specific decisions. Your Due Dilegence is a must!
• DiscoverGold
Recent GDX News
- YieldMax GDXY Name Change • GlobeNewswire Inc. • 01/25/2024 04:22:00 PM
- Surging S&P 500 Breadth • ValueWalk • 07/19/2023 03:16:37 PM
- S&P 500 Corrects In Breadth • ValueWalk • 07/18/2023 03:08:49 PM
- If The USDX Fell So Much, Why Didn’t Gold Truly Soar? • ValueWalk • 07/17/2023 05:16:20 PM
- USD’s Decline That’s… Bearish For Gold?! • ValueWalk • 07/12/2023 02:38:08 PM
- S&P 500 Late Day Reversal Worry • ValueWalk • 07/10/2023 03:17:34 PM
- Massive Gaming Celebrates Global Launch of House of Blackjack with USDC Earning Race • ValueWalk • 07/10/2023 02:44:17 PM
- Breathers In Mining Stocks Are Not Real Rallies • ValueWalk • 07/06/2023 05:20:55 PM
- S&P 500 Character Changes • ValueWalk • 07/06/2023 03:10:06 PM
- S&P 500 – As Bullish As It Gets • ValueWalk • 07/03/2023 04:01:21 PM
- The Great Gold Migration: How Asia Is Dominating The Global Gold Landscape • ValueWalk • 06/30/2023 05:07:35 PM
- S&P 500 Dip Buying And Tame PCE • ValueWalk • 06/30/2023 03:34:13 PM
- The Bullish Reversal In Gold Is Coming • ValueWalk • 06/29/2023 04:00:44 PM
- Insufficient S&P 500 Rotations • ValueWalk • 06/27/2023 02:41:42 PM
- Failing S&P 500 Rotations • ValueWalk • 06/23/2023 03:09:19 PM
- Countdown to S&P 500 Downleg • ValueWalk • 06/19/2023 01:49:20 PM
- Now THAT Was The Game-Changer For The Price Of Gold! • ValueWalk • 06/15/2023 04:40:35 PM
- S&P 500 Manages To Recover Initial Decline • ValueWalk • 06/15/2023 03:30:07 PM
- S&P 500 Manages To Recover From Tech-Driven Decline • ValueWalk • 06/15/2023 03:30:07 PM
- S&P 500 Withstands The Initial Selling – No Hike Tomorrow • ValueWalk • 06/13/2023 03:15:19 PM
- Roadmap For Mining Stocks – Courtesy Of The Stock Market • ValueWalk • 06/06/2023 03:17:49 PM
- Stocks To Still Extend S&P 500 Upswing • ValueWalk • 06/05/2023 03:31:02 PM
- AI, Stocks, And Gold Stocks – Connected After All • ValueWalk • 05/31/2023 03:29:15 PM
- Could Gold Miners Finally Stop Sliding?! • ValueWalk • 05/26/2023 08:42:37 PM
- S&P 500 Fine Selling Initiative • ValueWalk • 05/24/2023 03:06:00 PM
Coinllectibles' Subsidiary, Grand Town Development Limited, Acquires Rare Song Dynasty Ceramics Worth Over USD28million • COSG • Apr 18, 2024 8:03 AM
ILUS Provides Form 10-K Filing Update • ILUS • Apr 17, 2024 9:54 AM
Glucotrack Announces Expansion of Its Continuous Glucose Monitoring Technology to Epidural Glucose Monitoring • GCTK • Apr 17, 2024 8:00 AM
Maybacks Global Entertainment To Fire Up 24 New Stations in Louisiana • AHRO • Apr 16, 2024 1:30 PM
Cannabix Technologies Begins Certification of Contactless Alcohol Breathalyzer, Re-Brands product series to Breath Logix • BLOZF • Apr 16, 2024 8:52 AM
Kona Gold Beverages, Inc. Acquires Surge Distribution LLC from Loud Beverage Group, Inc. (LBEV) • KGKG • Apr 16, 2024 8:30 AM

