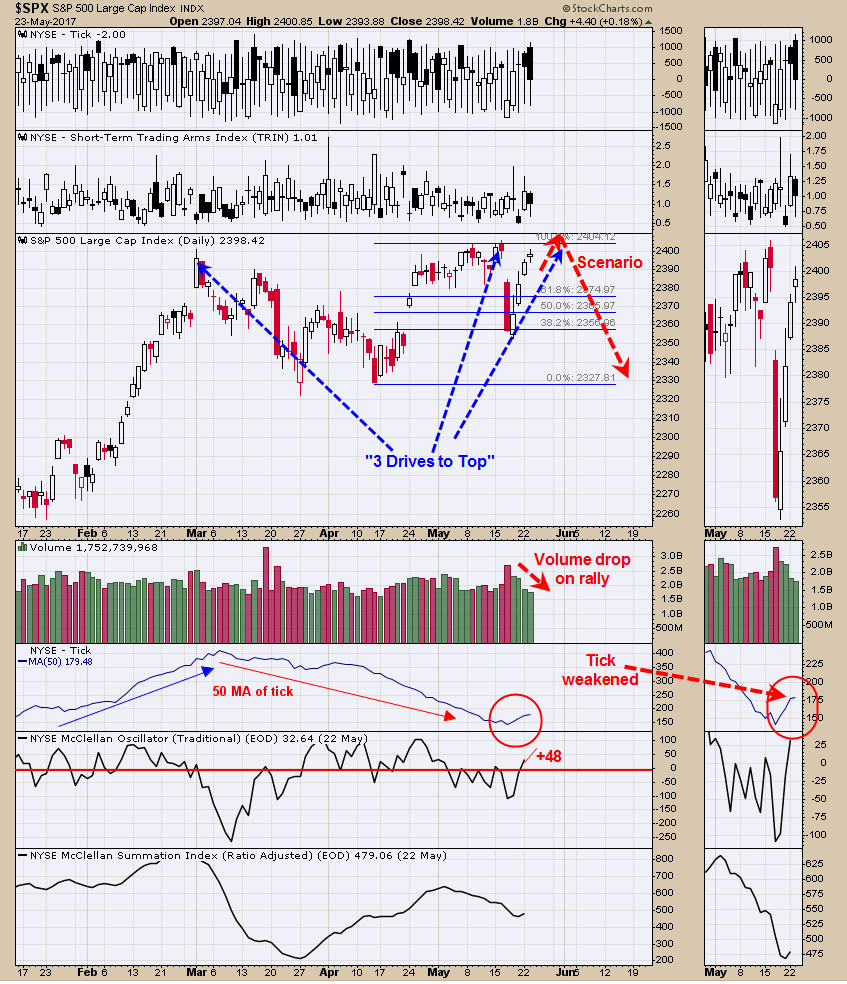
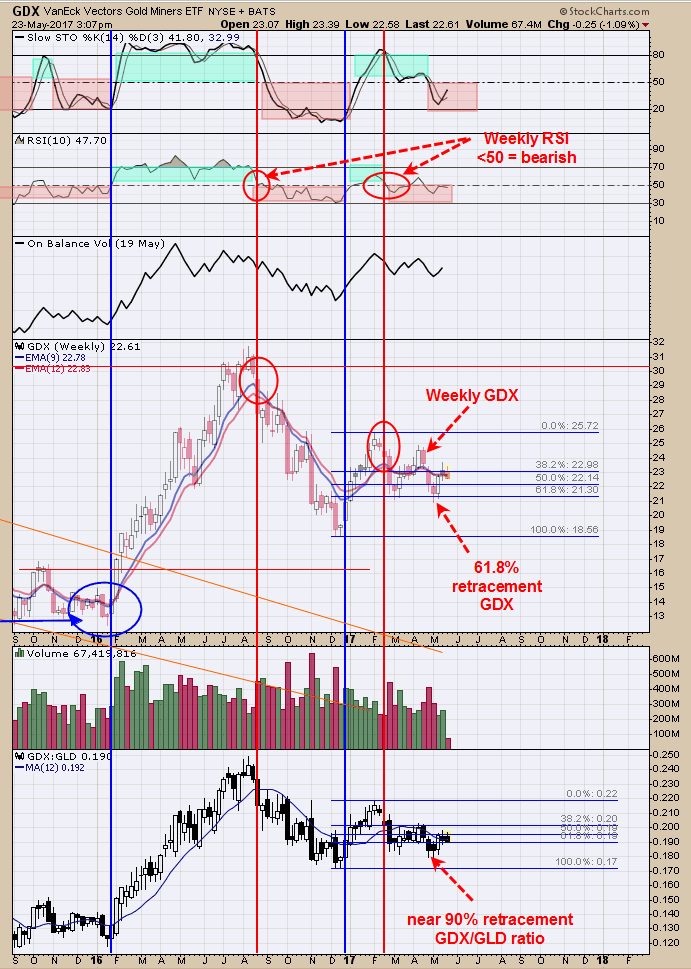
• SPX Monitoring purposes; Sold long SPX 5/23/17 at 2398.42 = +1.76%; Long SPX 5/17/17 at 2357.03. • Monitoring purposes Gold: Short GDX on 5/22/17 at 23.20. • Long Term Trend monitor purposes: Neutral.
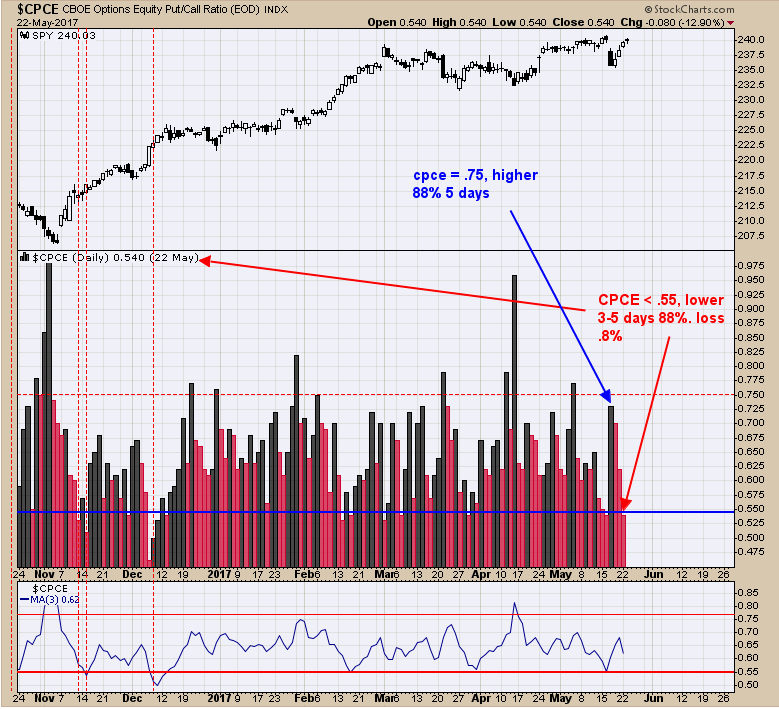
Yesterday the Equity put/call ratio (CPCE) closed at .54. CPCE readings less than .55 predict a lower market with an average loss of .8% at 88% of the time in the next 3 to 5 days. On 5/17/17 the CPCE (day of low close on the SPX) closed at .73. CPCE > .75 (.73 close enough) predict a market rally next 3 to 5 days average gain of 1.3% at 88% of the time and that worked out to a tee. There is evidence market may hold up into Friday as the McClellan Oscillator made a higher high today and the VIX made a lower low both of which are bullish short term but volume is dropping and the CPCE is showing a bearish sign so we elected to exit our long SPX for a gain of 1.76% gain.
The second window up from the Bottom is the NYSE McClellan Oscillator. With today’s rally the McClellan Oscillator reached +48 range up from yesterday’s +28 range and a bullish sign. Next window up is the 50 day moving average of the tick. When the 50 day MA tick is rising, its a bullish sign and it has been rising since 5/17/17 until today which turned sideways. Notice that volume has been dropping each day and the range has been decreasing which is a weakening position for the market. Market could still push higher (minimum ally) into Friday but upside appears limited. So far it looks like the “Three Drives to Top” pattern that we have been discussing in our reports is still in play. Short term new highs is possible but not much more.
Above is the weekly chart of GDX. Bottom window is the weekly GDXGLD ratio. GDX/GLD ratio leads the way for GDX. The weekly GDX/GLD ratio retraced near 90% of the rally form the December low, where GDX just retraced 61.8% showing that GDX/GLD ratio is weaker than GDX. This condition suggests for GDX to catch up to GDX/GLD ratio, GDX must fall. The second window from the top is the weekly RSI for GDX. RSI >50 is bullish for GDX and < 50 bearish. In general the weekly RSI has been below 50 since February and remains bearish. Notice that the weekly Slow Stochastics is also below 50 and in bearish territory. Short GDX on 5/22/17 at 23.20.
Click on "In reply to", for Authors past commentaries
Information posted to this board is not meant to suggest any specific action, but to point out the technical signs that can help our readers make their own specific decisions. Your Due Dilegence is a must! • DiscoverGold
Register for free to join our community of investors and share your ideas. You will also get access to streaming quotes, interactive charts, trades, portfolio, live options flow and more tools.


 News
News  Market Data
  Discover